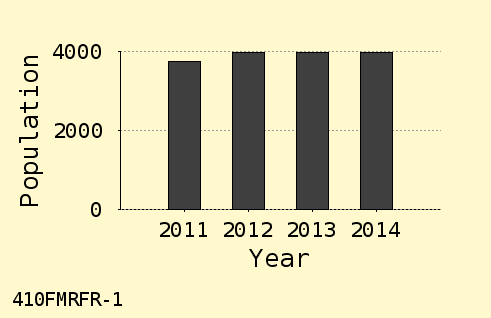
Background Color for Chart
(20 options)

White
Grey 95
Lemon Chiffon
Light Cyan
|
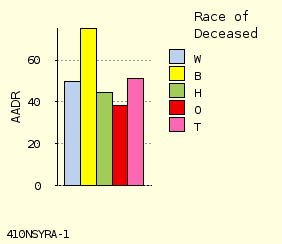
Color Palette for Bars
(4 options)
Bright Colors
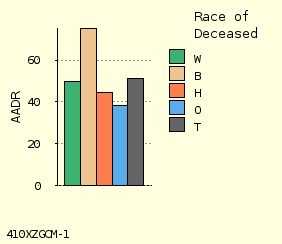
Subdued Colors
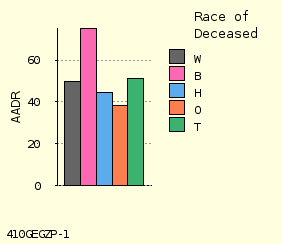
Bright + Subdued
Black + White
|
First Color in Palette to Use
(10 options)
A Forward
D Reverse
E Forward
J Reverse
|
Vertical or Horizontal Bars
Vertical Bars
Horizontal
Stacked Bars?
Stacked Bars
Not Stacked
|
Height of Each Bar
(9 options)
2 cm High
4 cm High
Width of Each Bar
(8 options)
0.2 cm Wide
0.6 cm Wide
|
Include Grid Lines?

Include Grid
Omit Grid
Font Size for Chart Text
(8 options)
10 pt Font
14 pt Font
|
Background Color for Chart
(20 options)
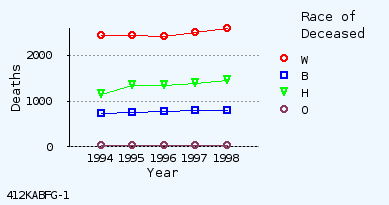
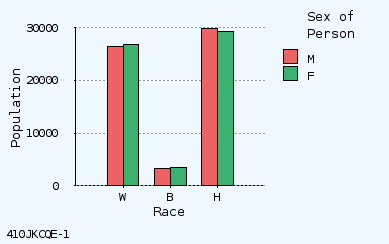
Alice Blue
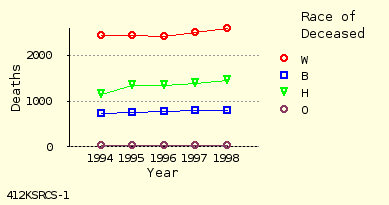
Light Yellow
|
Include Data Point Symbols?
(2 options)
Include Symbols
Omit Symbols
|
Radius for Chart Symbols
(10 options)
1.0 mm Radius
1.4 mm Radius
|
Line Chart Height
(9 options)
4.0 cm (Not Shown)
7.0 cm (Not Shown)
|
Width of Lines
(3 options)
Thin Lines
Thick Lines
|
Include Grid Lines?
(2 options)
Include Grid
Omit Grid
|
Colored Lines, or Black + White
(2 options)
Colored Lines
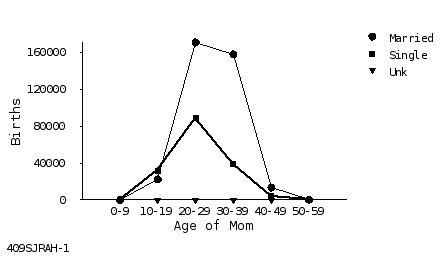
Black + White Lines
|
Font Size for Chart Text
(8 options)
10 pt Font (Not Shown)
12 pt Font (Not Shown)
|
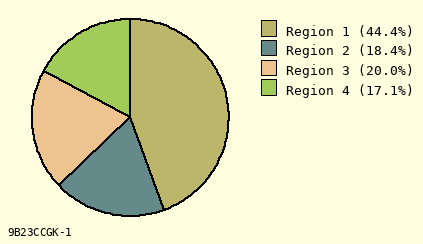
Background Color for Chart
(20 options)
Cornsilk Background
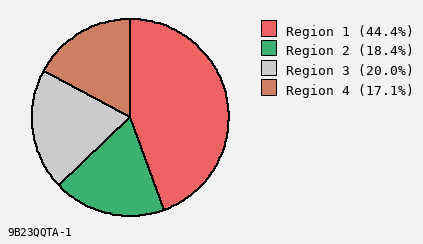
Grey Background
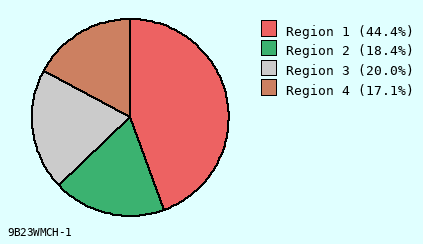
Light Cyan
|
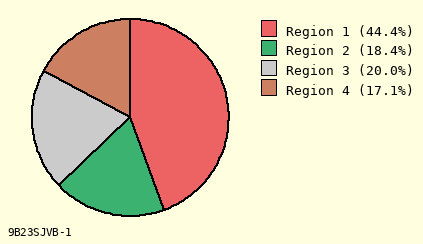
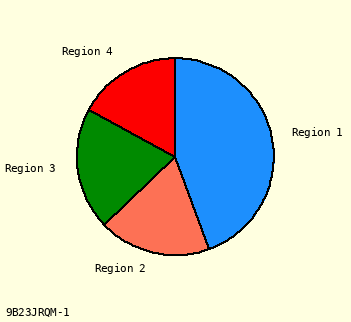
Color Palette for Pie Chart
(3 options)
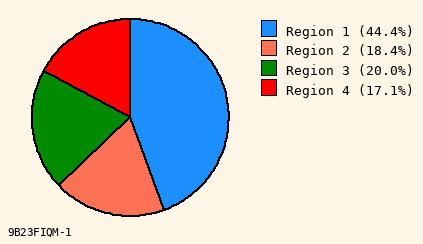
Bright Colors
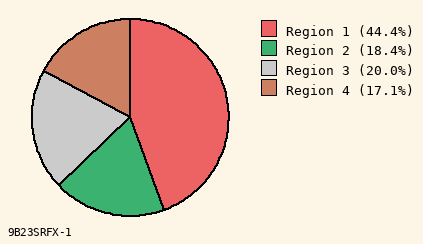
Subdued Colors
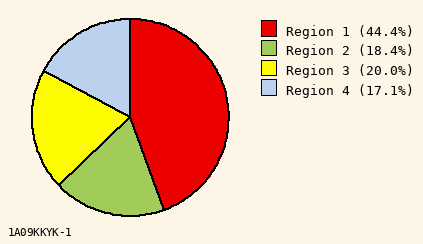
Mixed Colors
|
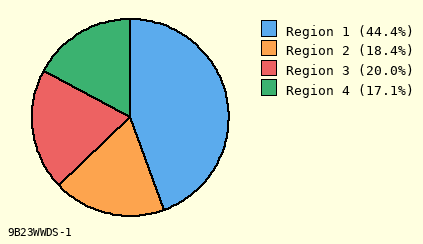
Slice #1 Color to Use
(10 options)

Color A for #1
I Forward
F Reverse
|
Slice #1 Clock Position
(12 options)
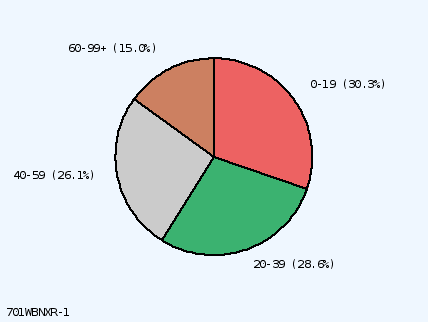
Slice #1 at Noon
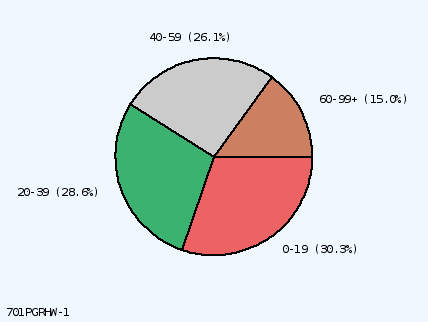
Slice #1 at 3:00
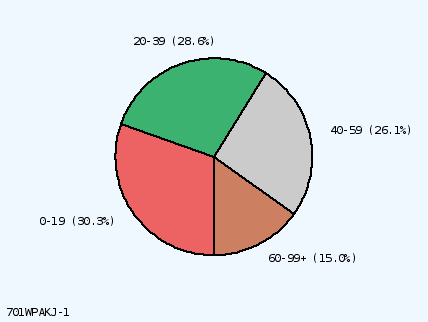
Slice #1 at 6:00
|
How to Label Pie Chart
(9 options)
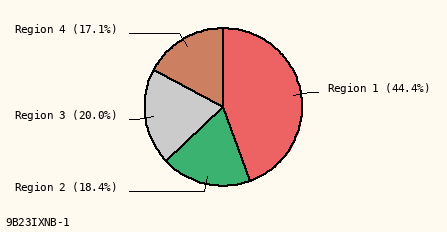
Line + Label
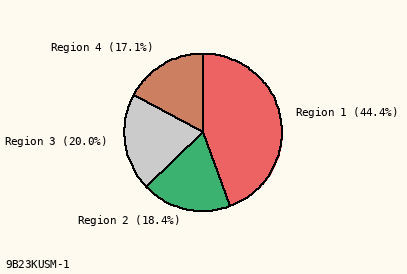
Label Only

Use Legend
|
How to Display Slice Percents
(3 options)
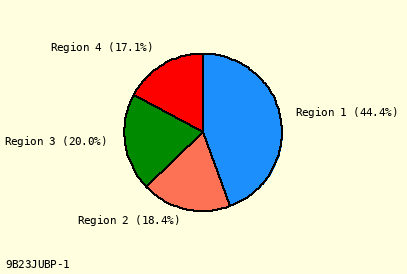
Percent After Label
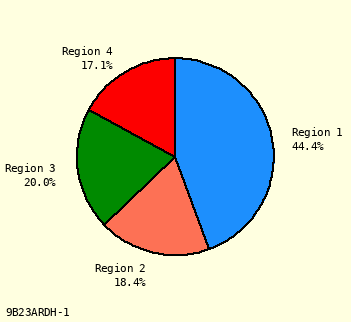
Under Label
Omit Percents
|
Pie Chart Radius
(9 options)
3.0 cm (Not Shown)
4.0 cm (Not Shown)
5.0 cm (Not Shown)
|
Color Combination
(36 options)
|
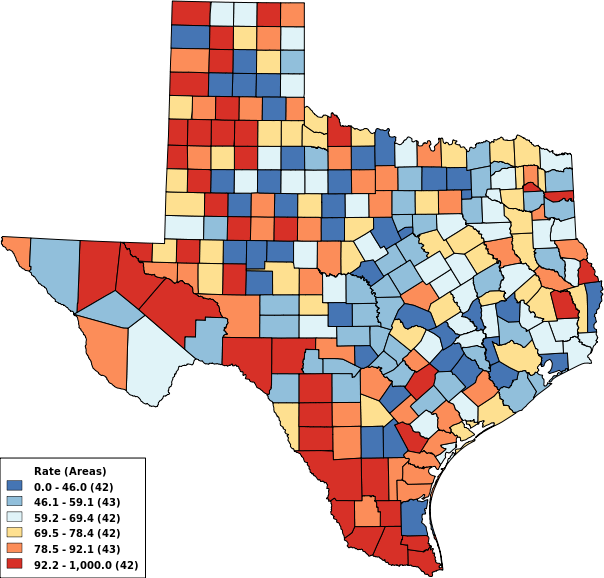
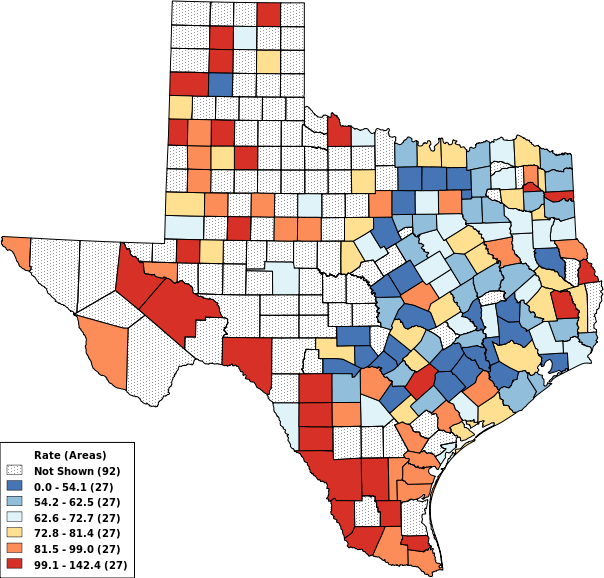
Number of Colors
(8 options)
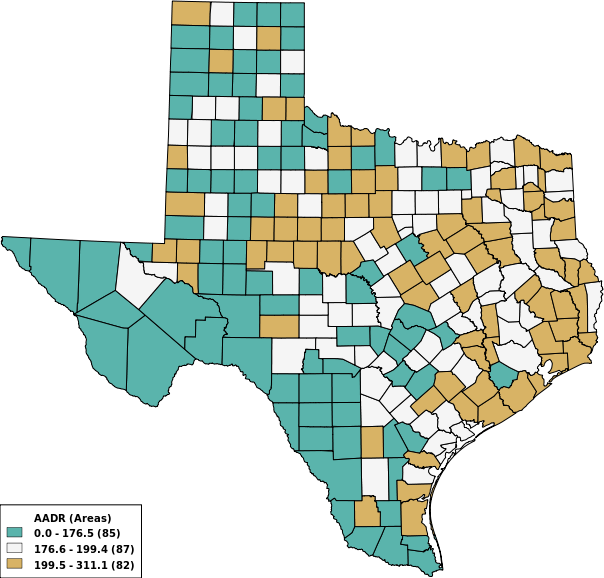
3 Colors
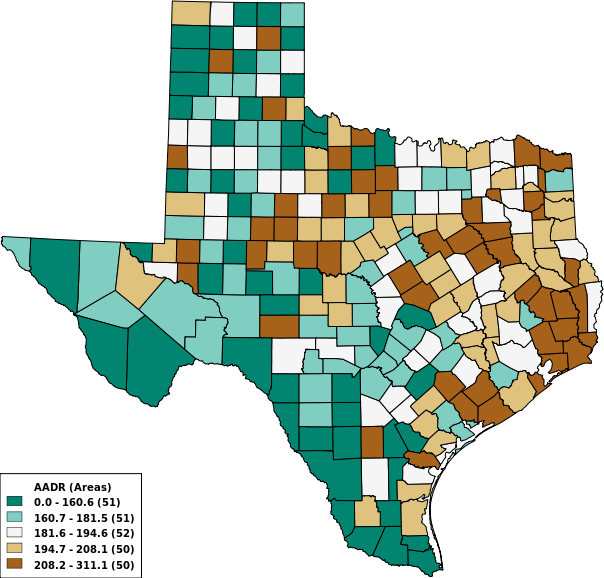
5 Colors
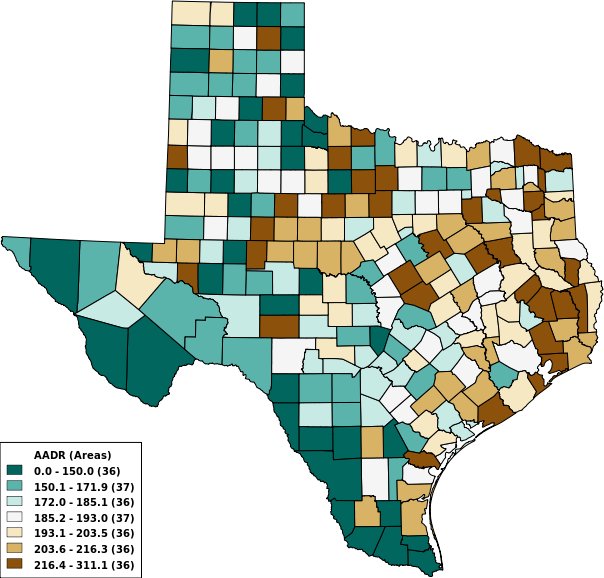
7 Colors
|
How to Set Ranges
(3 options)
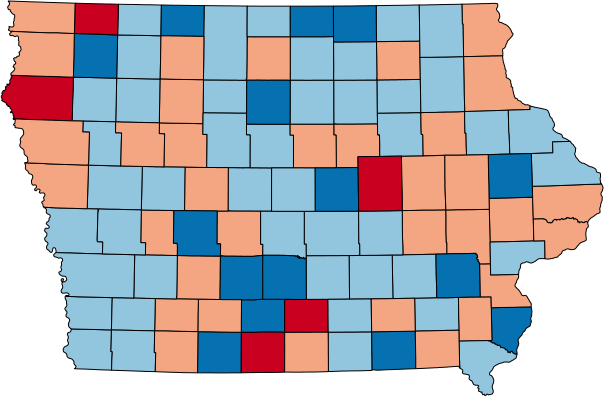
Equal Ranges
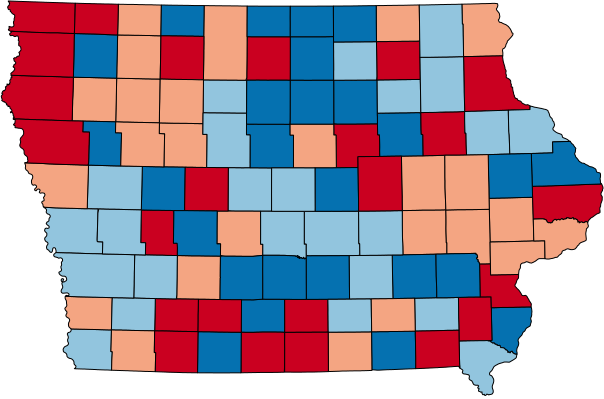
Equal Counts
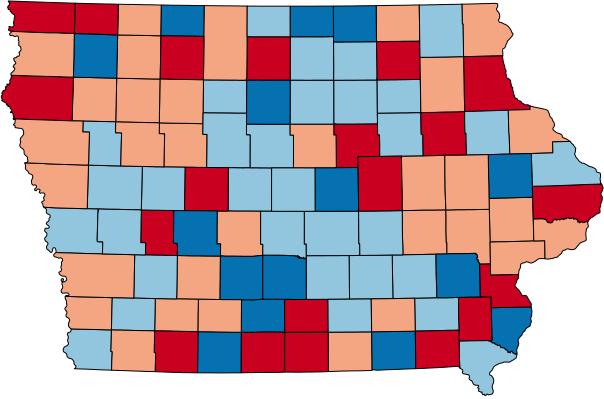
Natural Breaks
|
Boundaries to Display
(6 options)
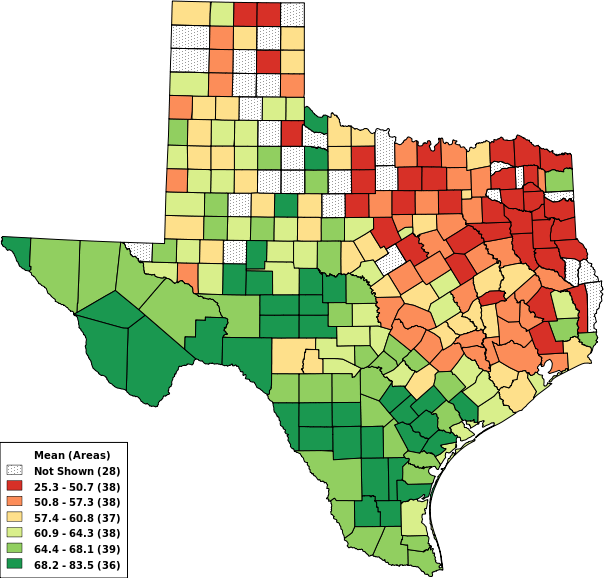
County Boundaries
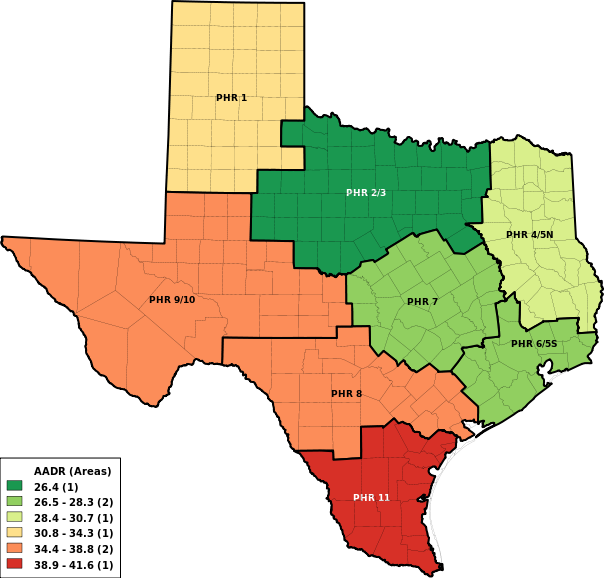
HSR Boundaries
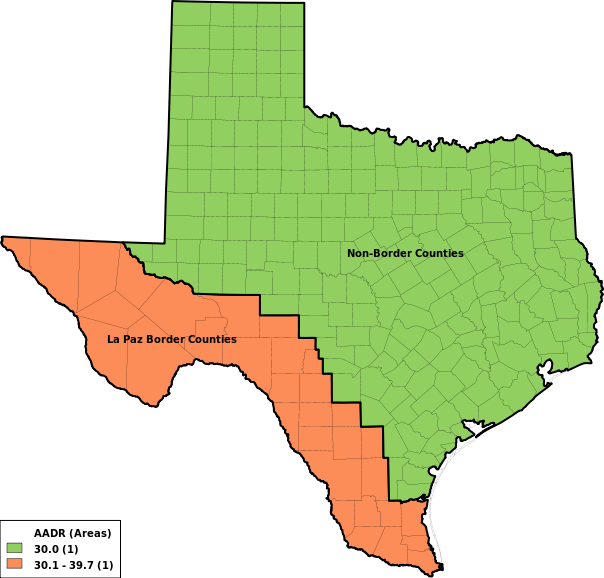
Border Counties
|
Cell Suppression
(14 options)
Suppression Off
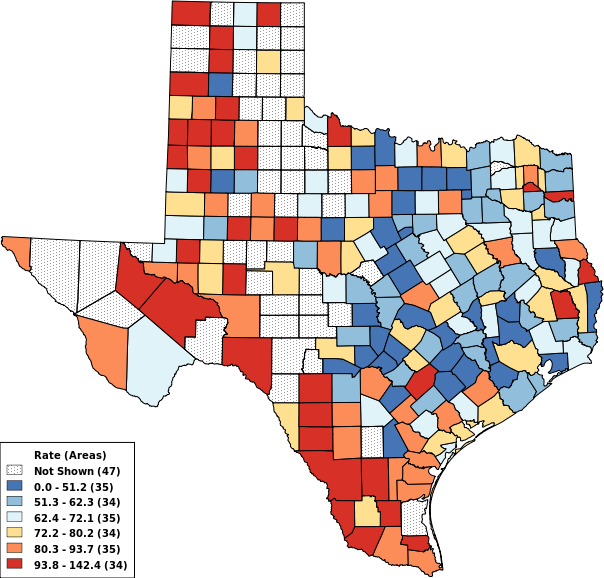
Suppress if < 10 Events
Suppress if < 30 Events
|
Map File Format
(PNG, PDF, SVG, GIS)
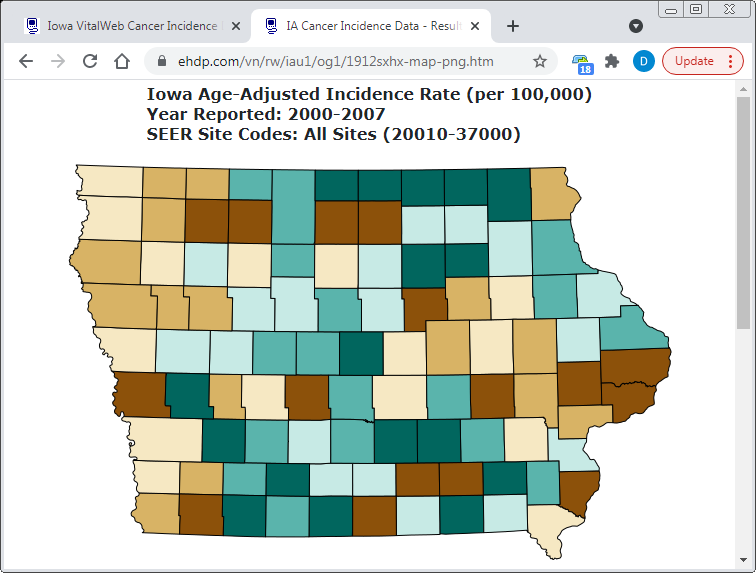
PNG Map (Imports Best)
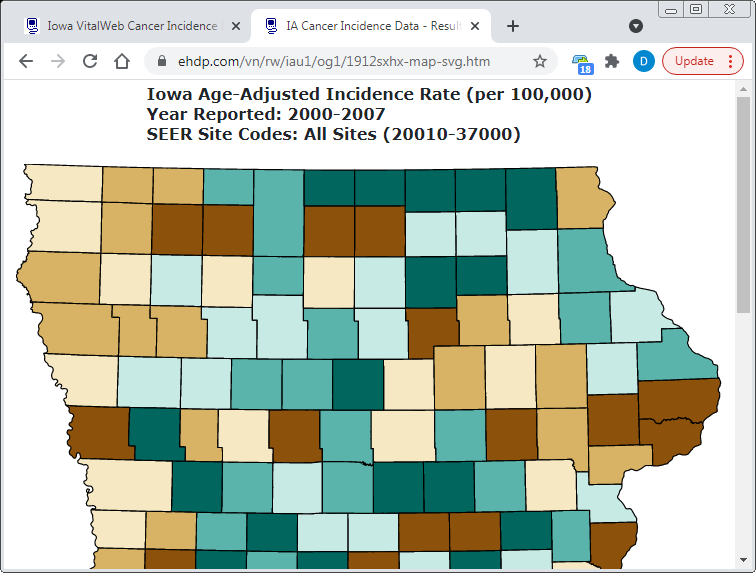
SVG Map (Prints Best)
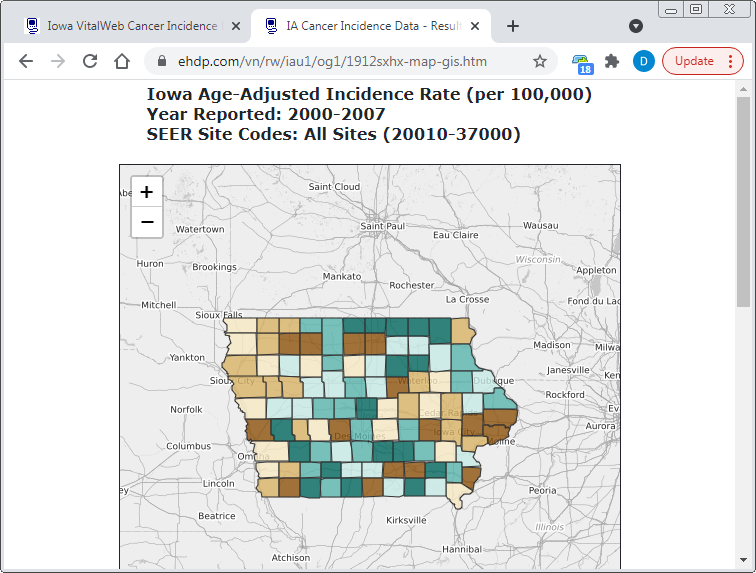
GIS Map (Interesting)
|