Vitalnet Table Examples
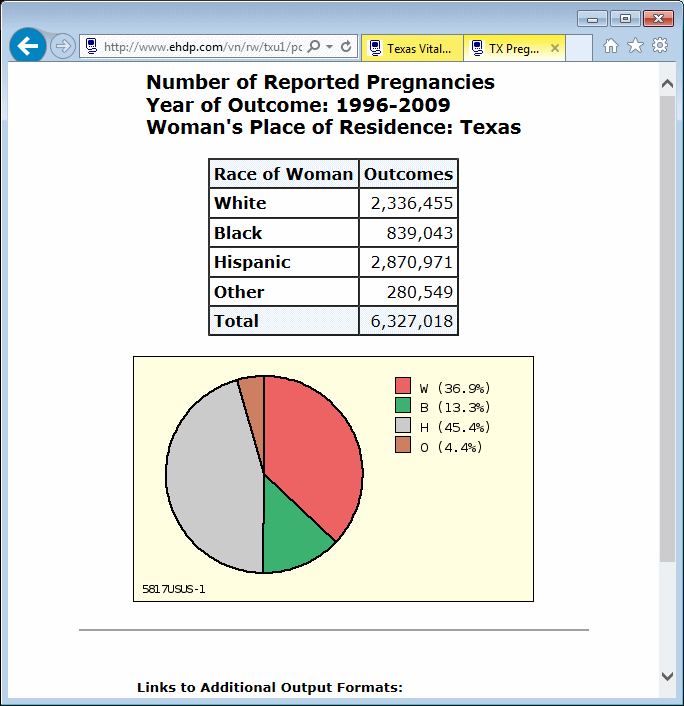
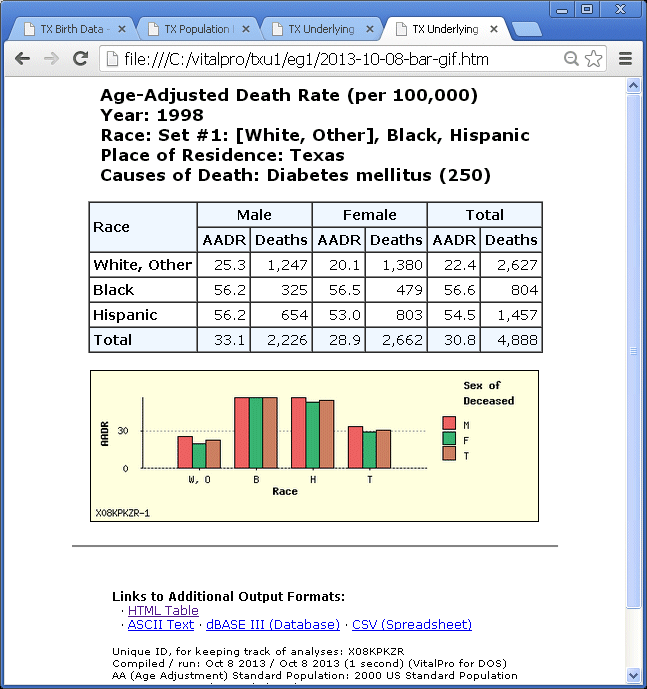
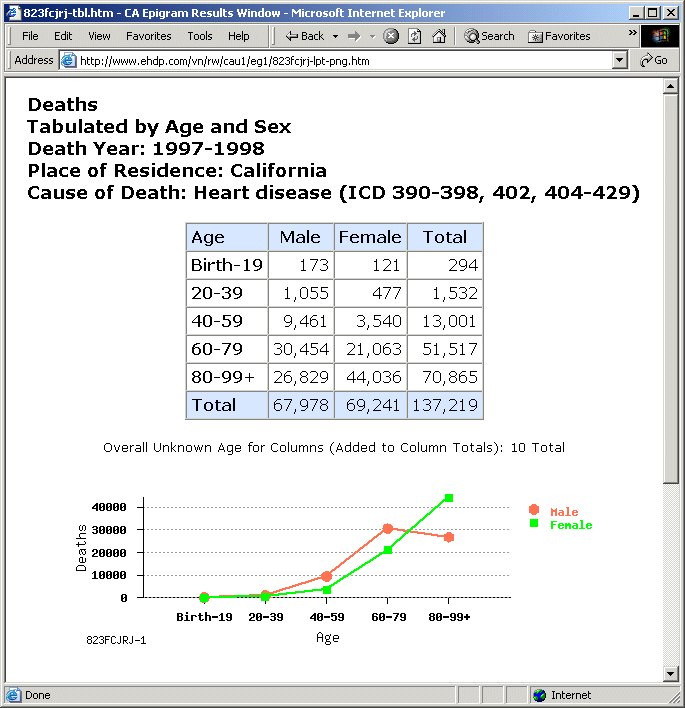
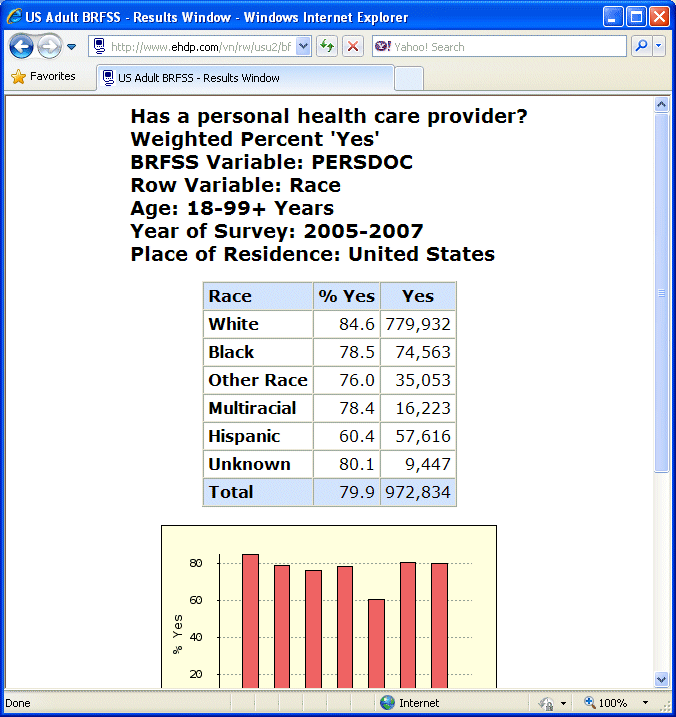
Vitalnet tables attractively display numerical output. Vitalnet allows you to easily customize a table in many different ways, to best display and compare the data.
Examples of Vitalnet table capabilities:
|
Age Groups:
Five Year · Twenty Year · Custom Ages |
|
Cell Confidence Level:
CI Off · 95% Level · 99% Level |
|
Cell Suppression:
Suppress Off · Suppress 0-3 · Suppress 0-10 |
|
Decimal Digits:
One Digit · Three Digits |
|
HTML Line Style:
Gray Lines · Dark Boxes + Header |
|
HTML Output Font:
Courier · Cursive · Verdana |
|
HTML Padding:
0.30rem · 0.45rem · 0.60rem |
|
Leading Causes (LC):
LC for Deaths · LC for YPLL |
|
Multi-Tables:
Race Tables · Row Variable · Statistic · Areas |
|
Main Statistic:
Deaths · AADR Stat · SMR Stat · YPLL Stat |
|
Rows / Columns:
One Row · One Column · Both Used |
|
Row Sorting:
Not Sorted · High to Low · Low to High |
|
Second Output:
HTML File · ASCII File · CSV File · dBASE III |
|
Sets of Items:
Race sets · Area sets |
|
Tabular Chart:
50 Pixels · 150 Pixels · Chart Off |
|
Table Percents:
Column Pcts · Row Pcts · Percents Off |
|
Time Trend Confidence Level:
Trend Off · 95% Trend · 99% Trend |
|
Year Groups:
One Year · Two Year · Three Year |
Additional tables, to show capabilities
Bar · Line · Pie · Maps · Output Home


