Jenks Natural Breaks vs Alternative Methods
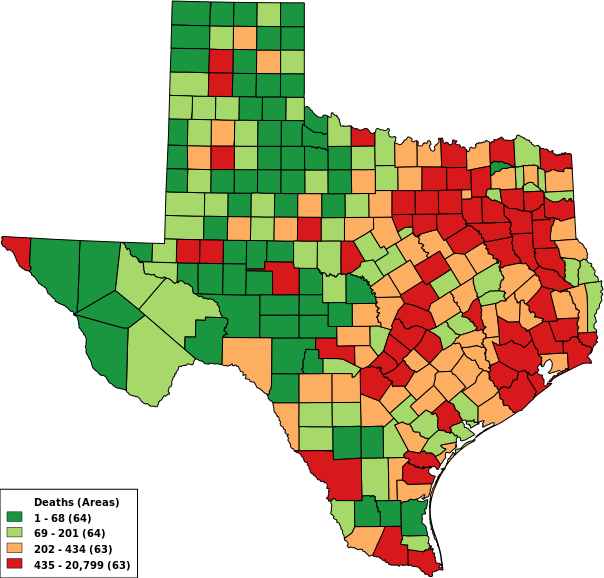
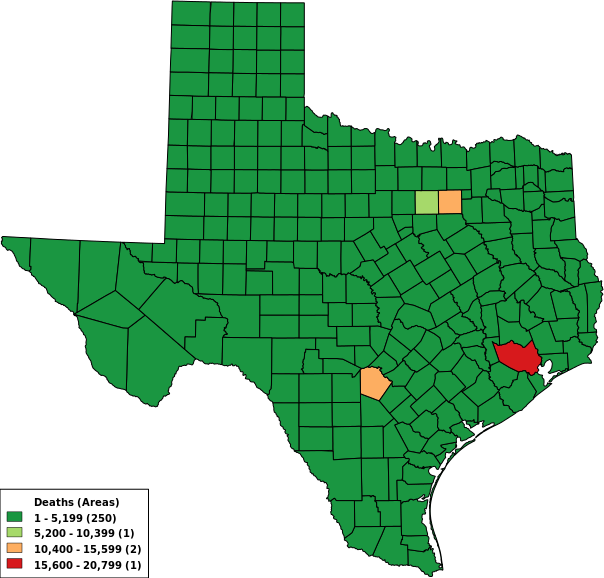
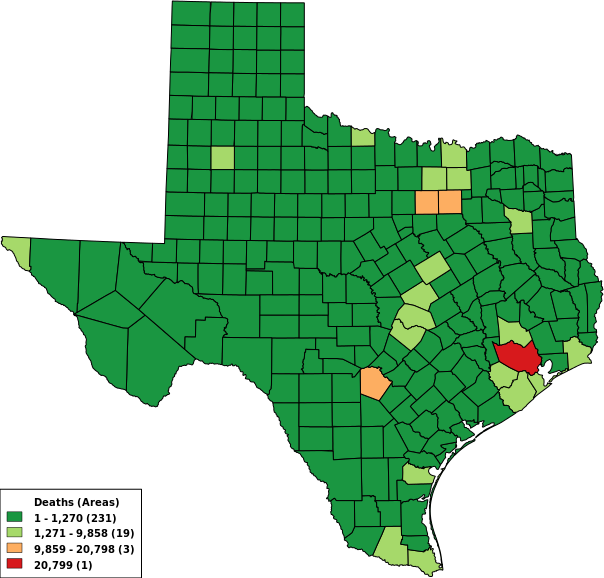
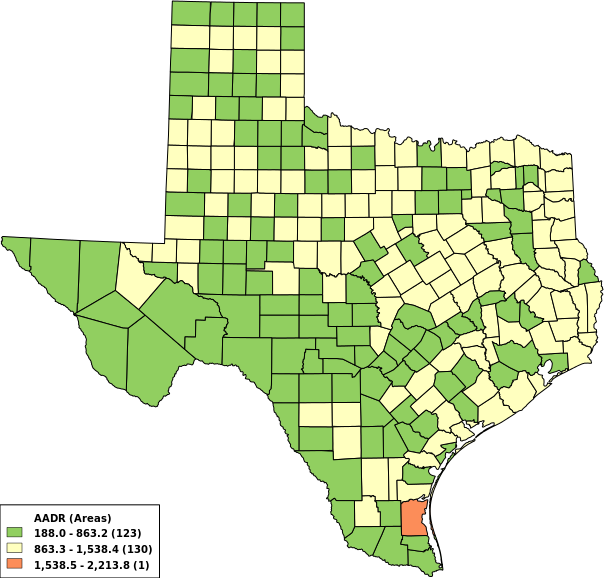
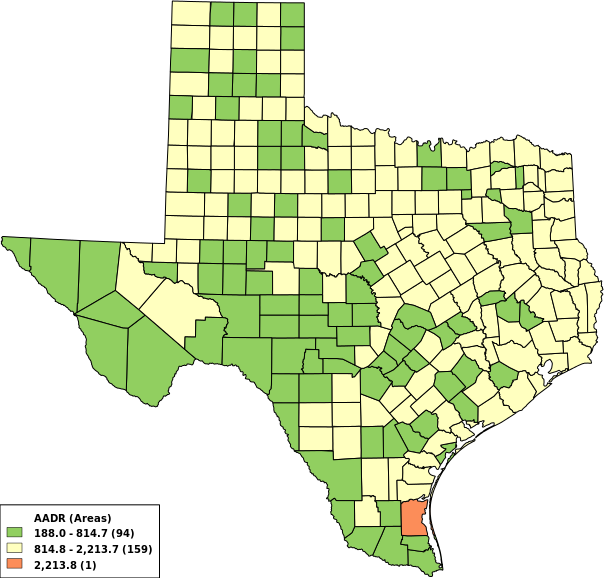
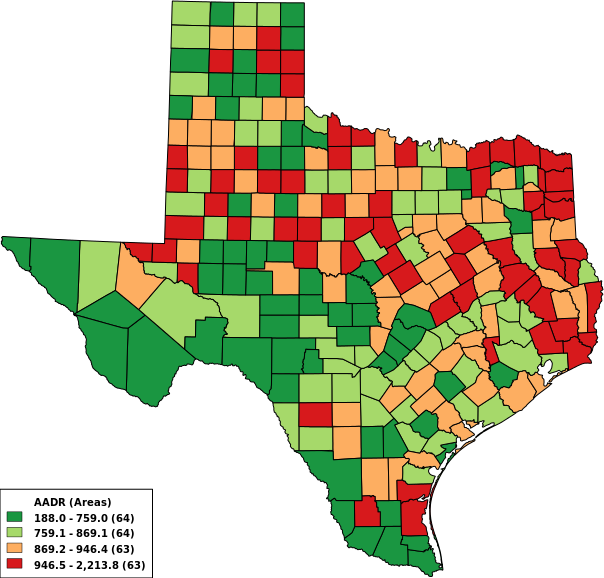
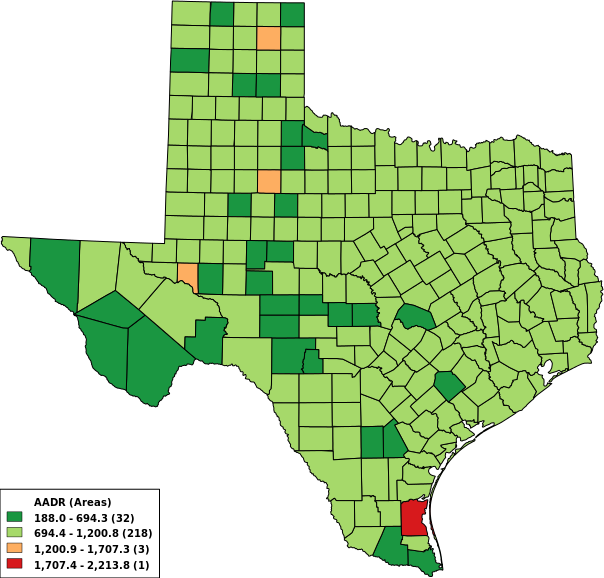
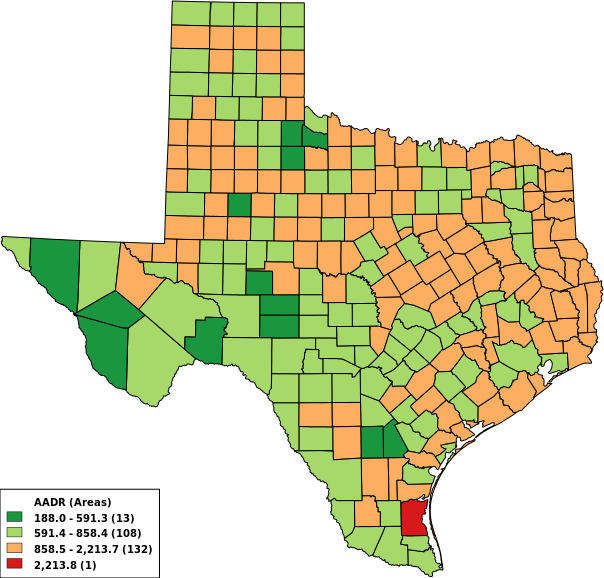
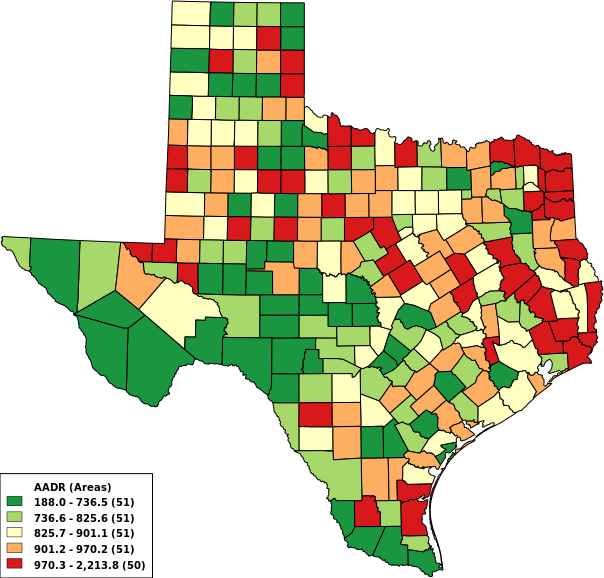
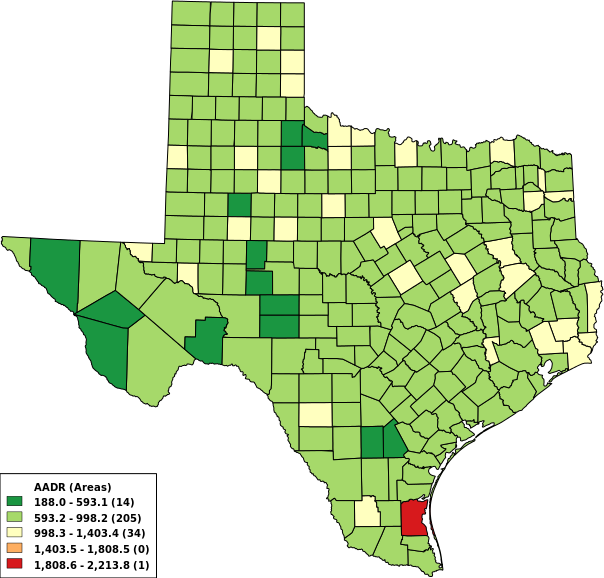
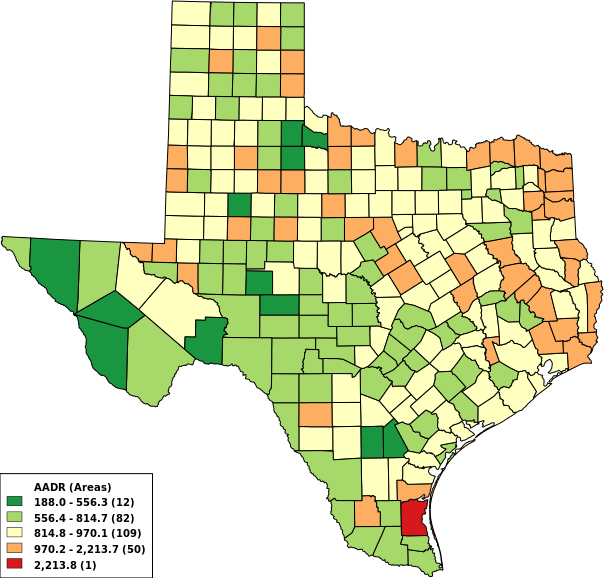
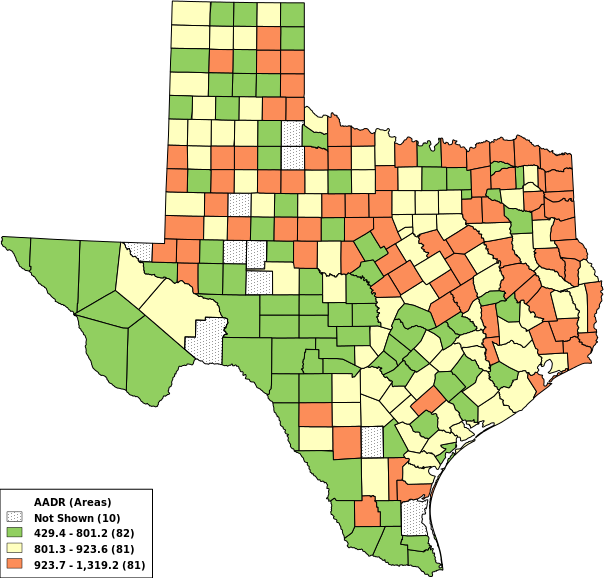
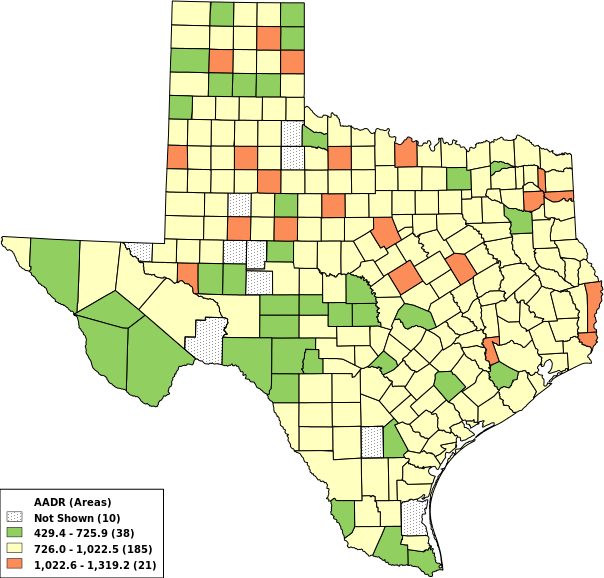
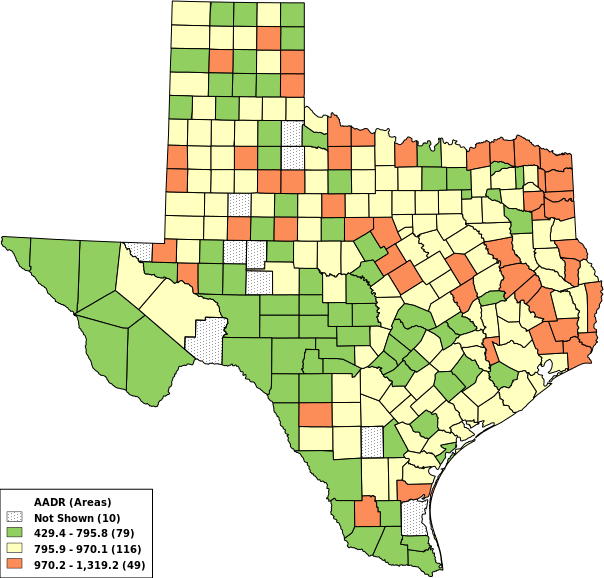
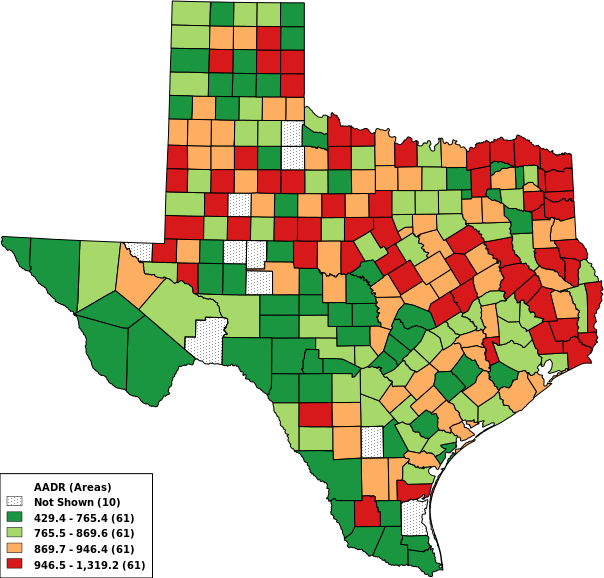
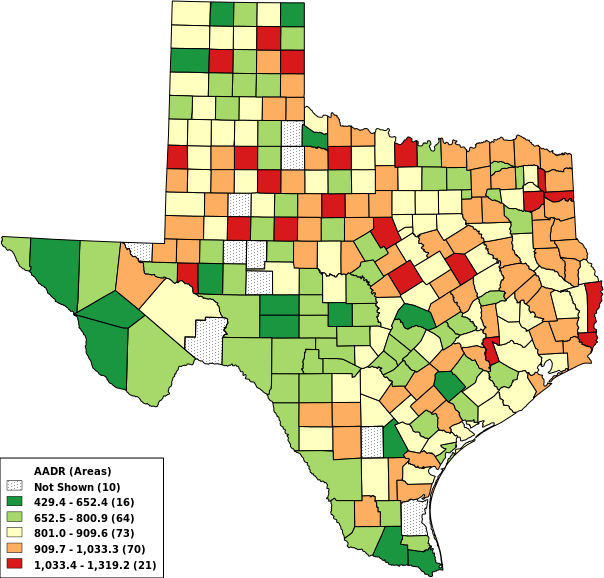
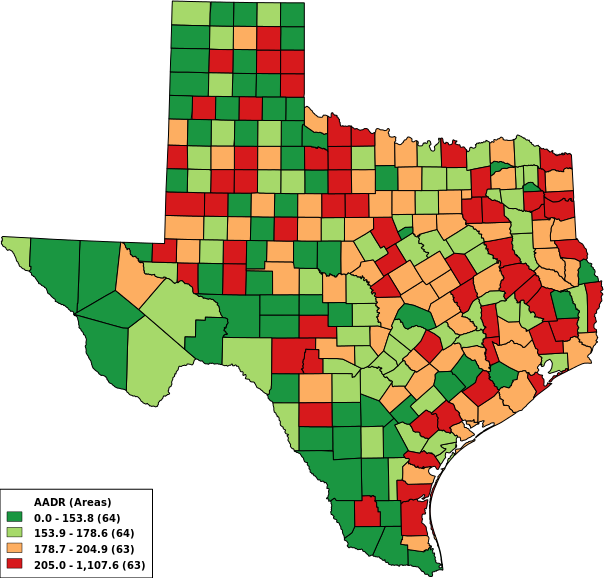
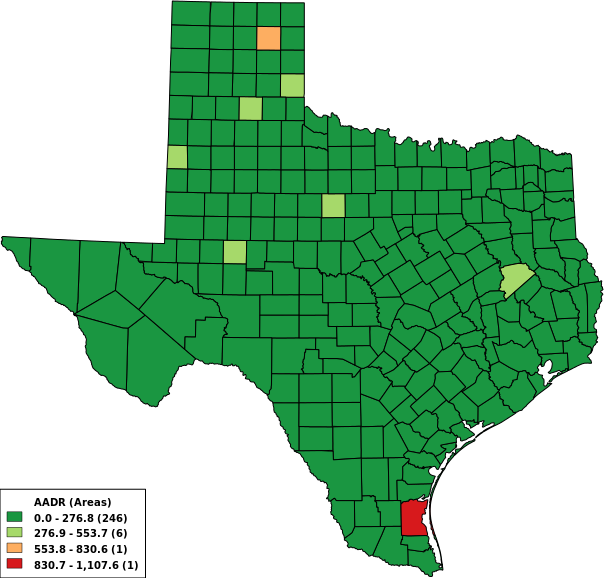
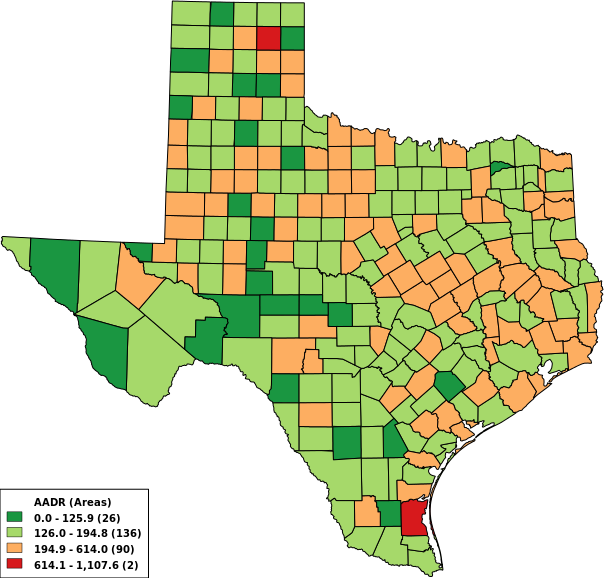
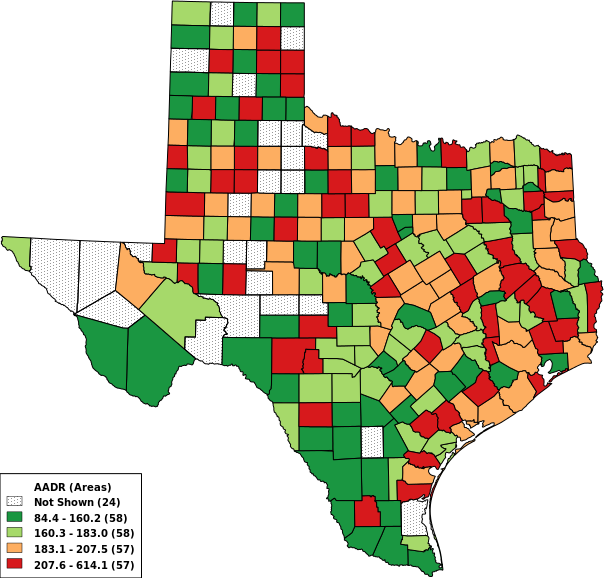
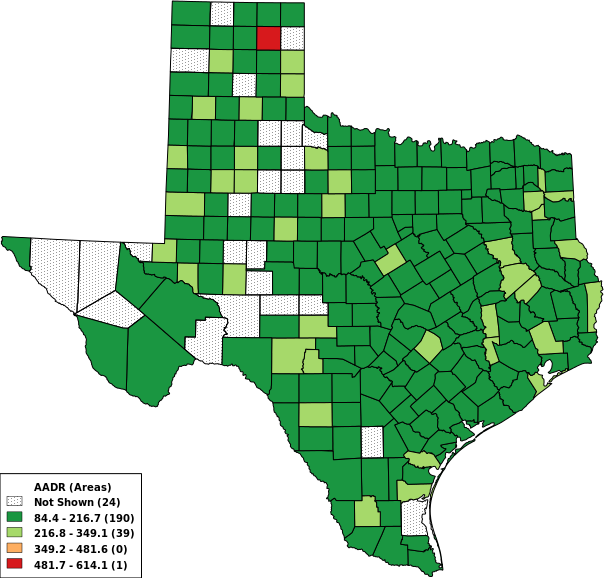
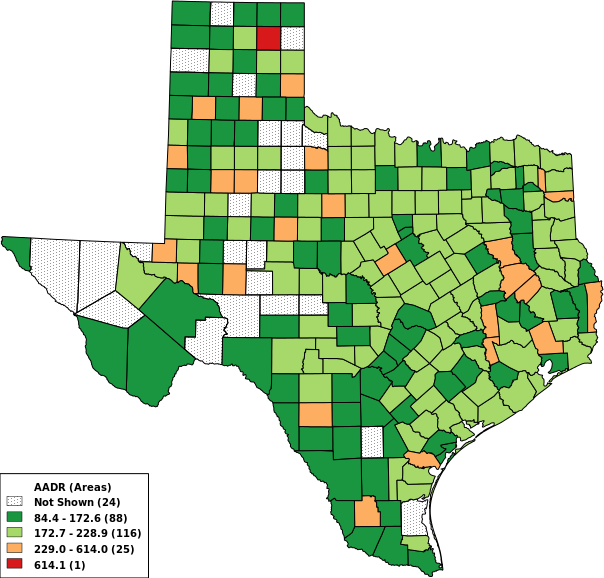
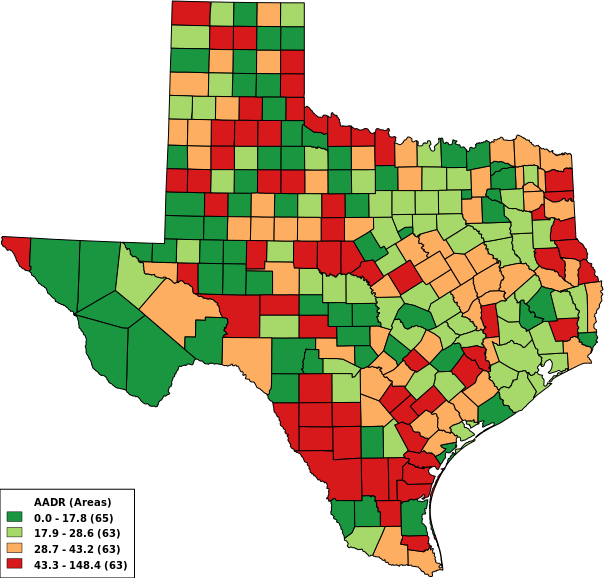
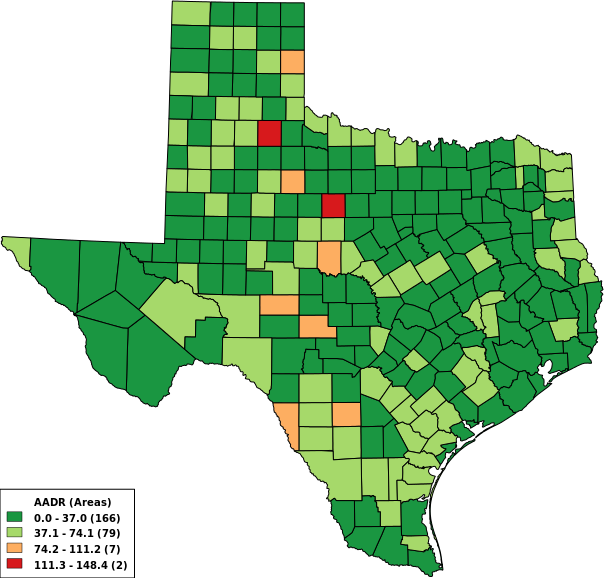
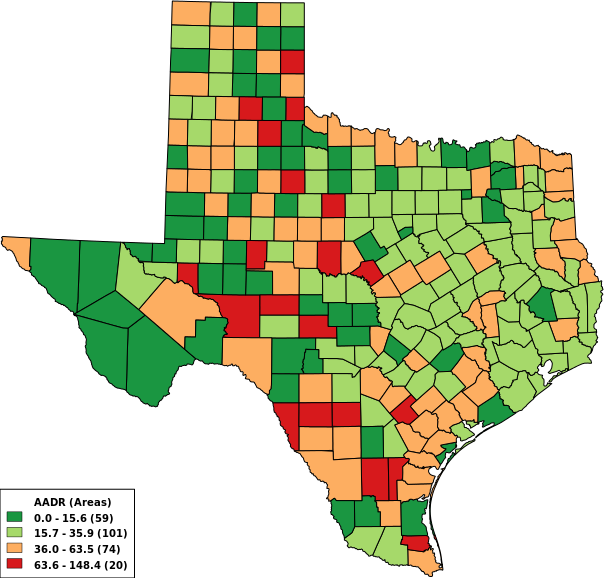
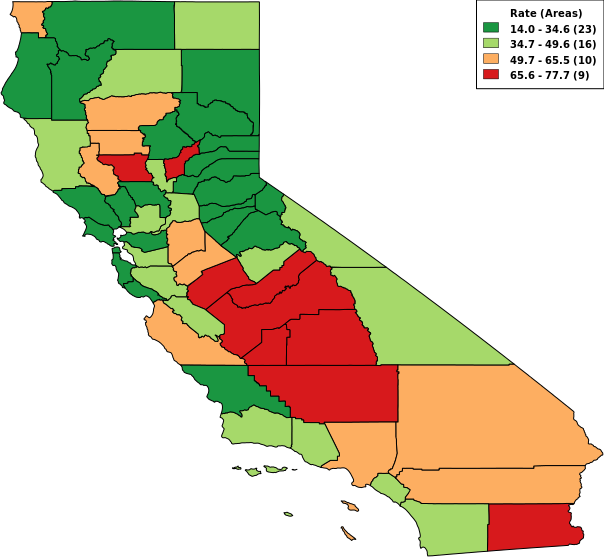
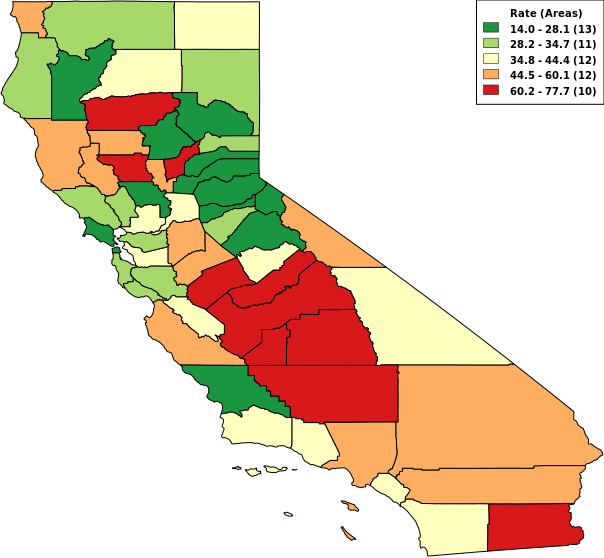
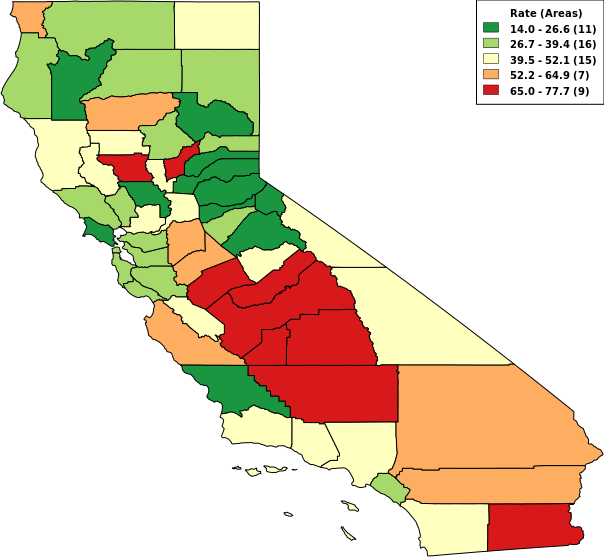
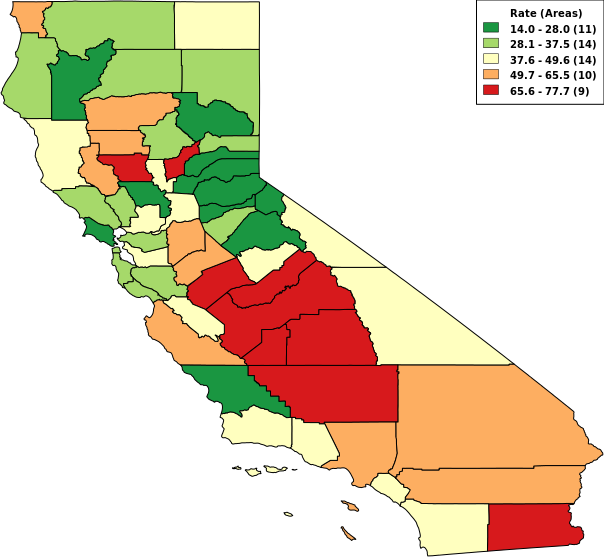
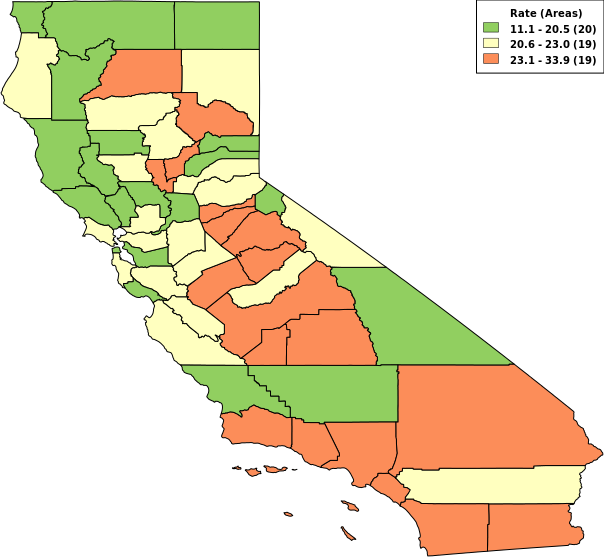
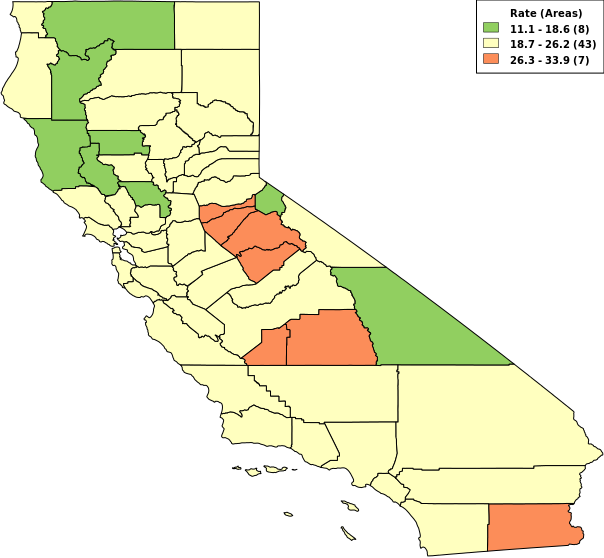
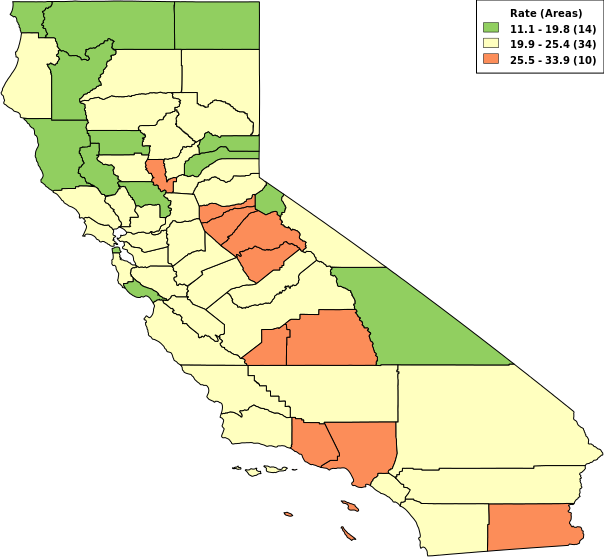
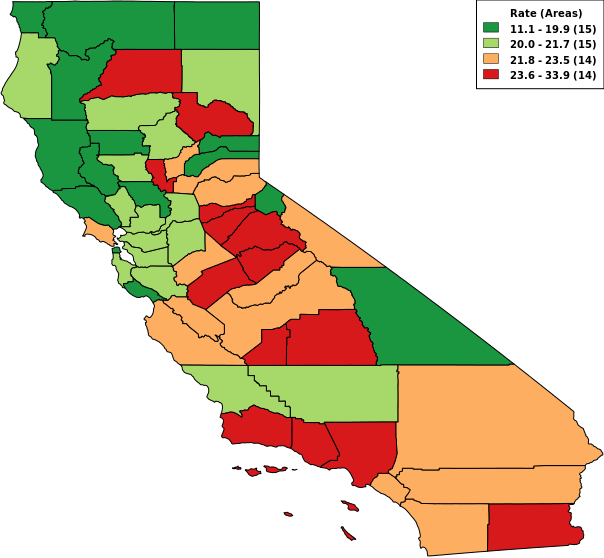
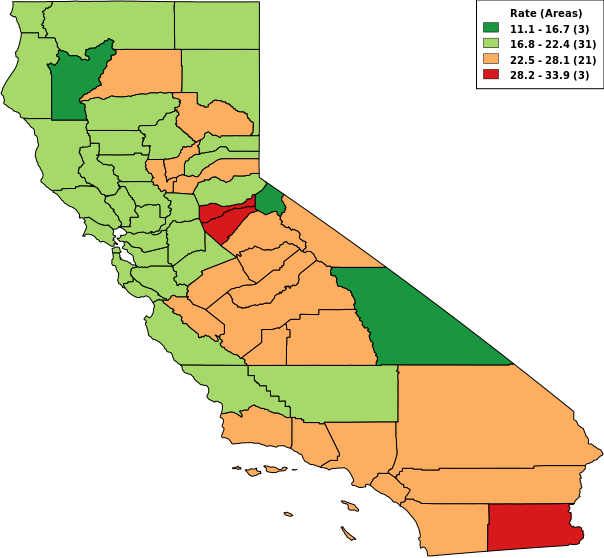
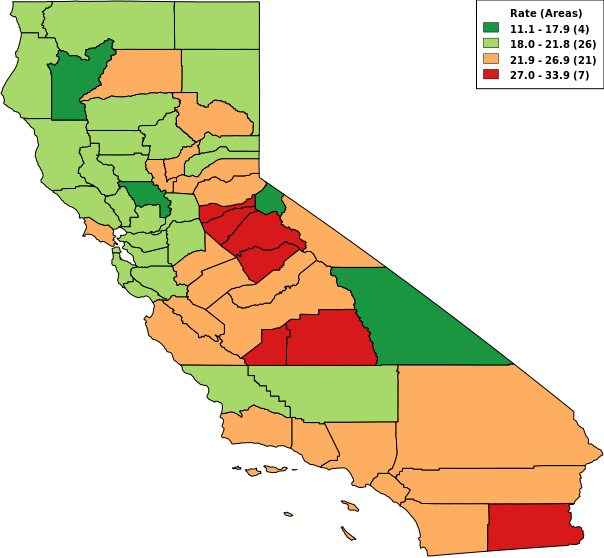
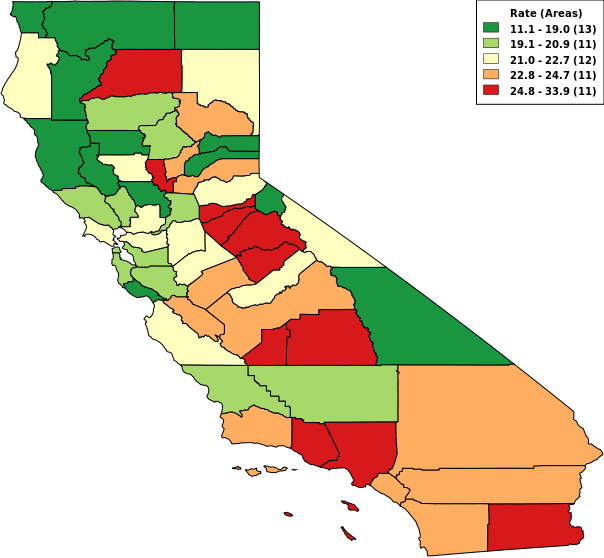
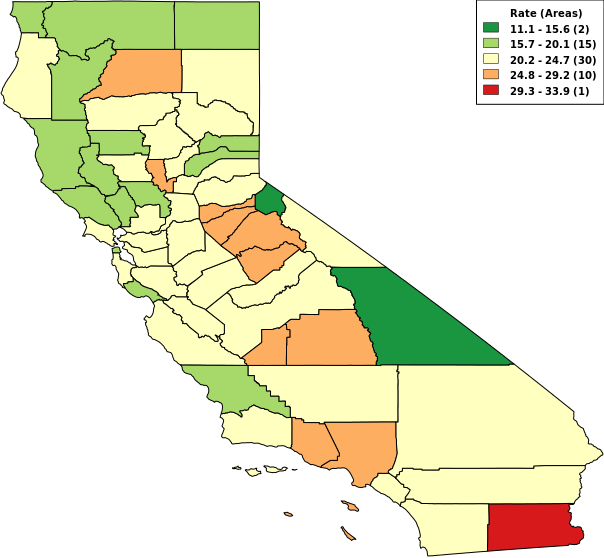
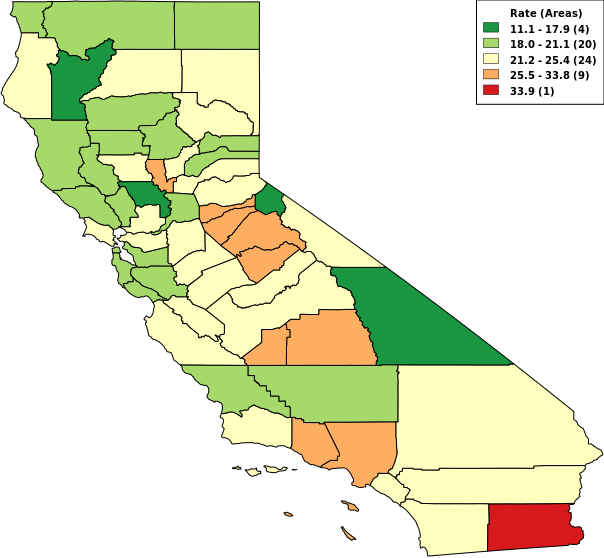
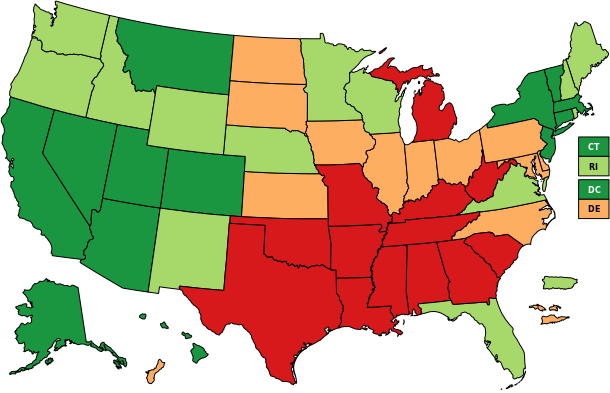
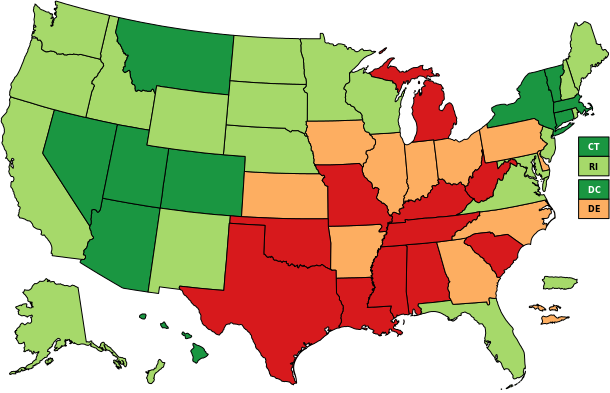
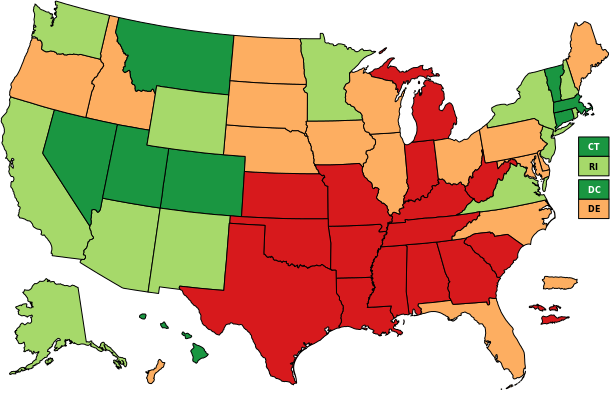
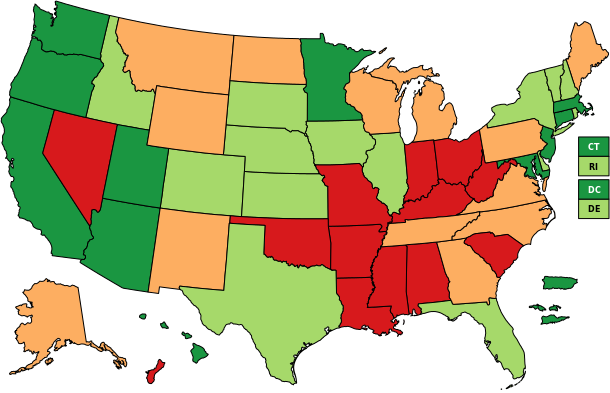
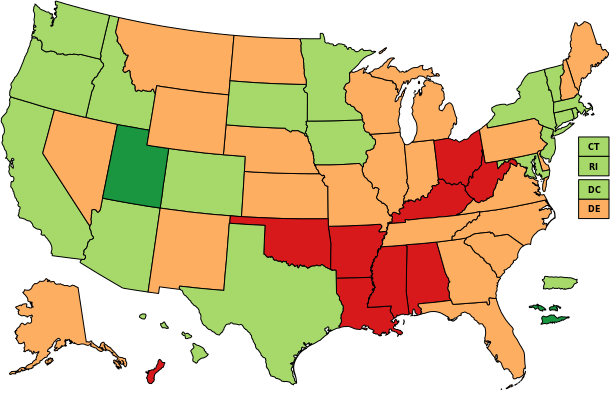
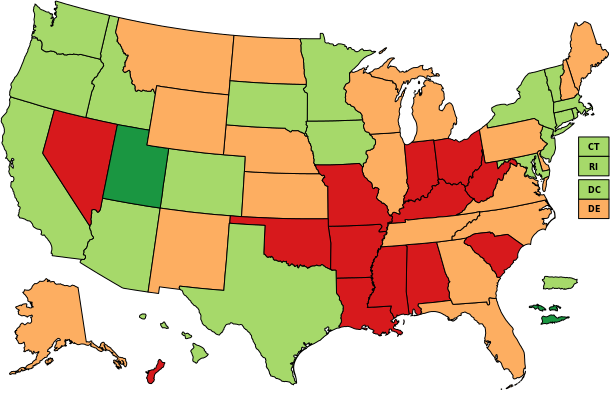
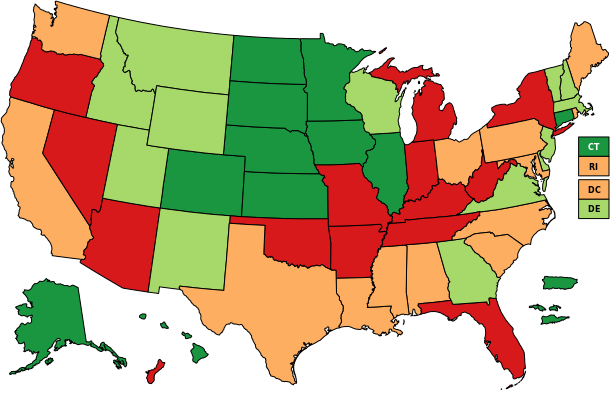
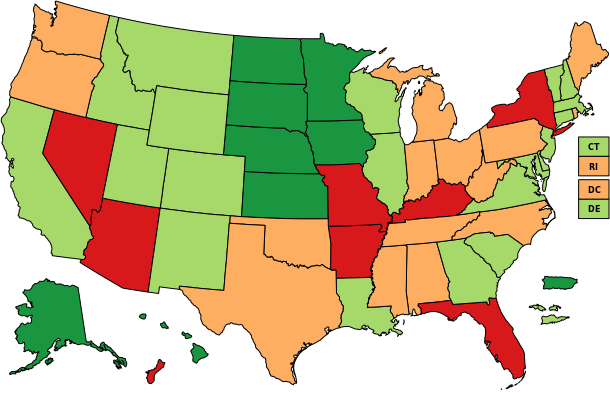
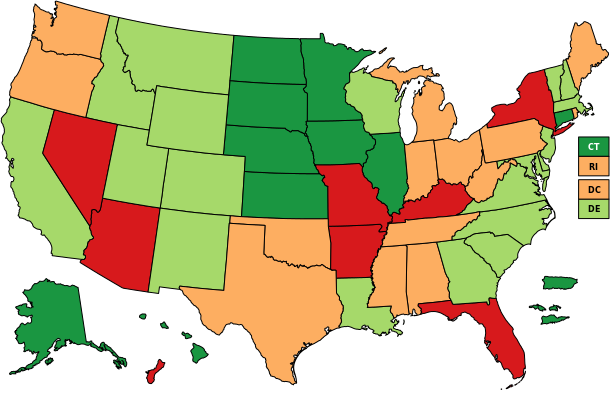
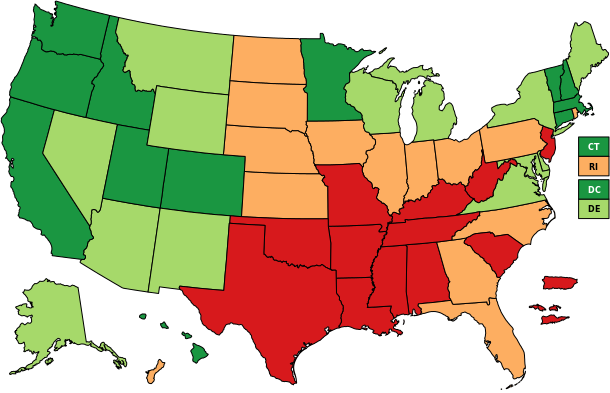
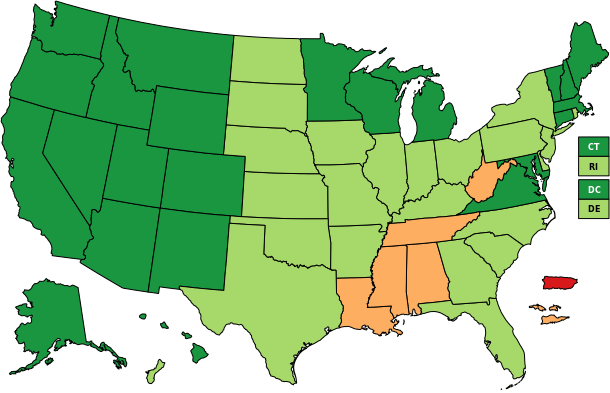
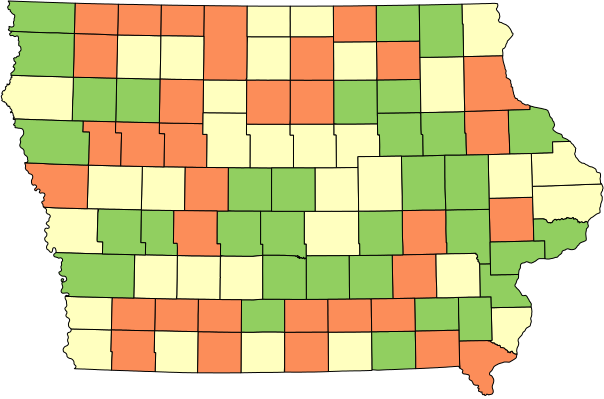
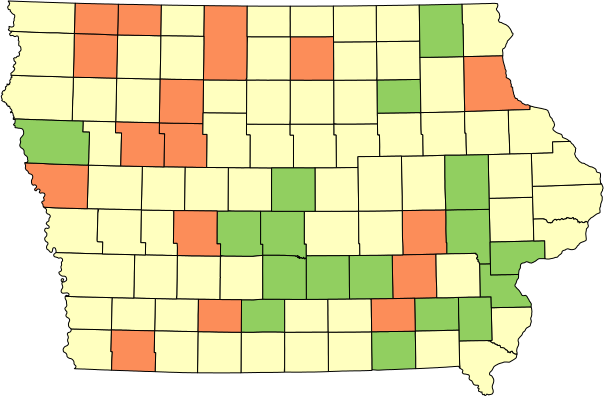
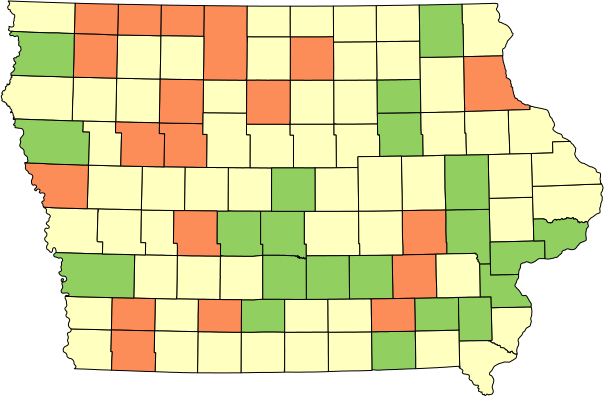
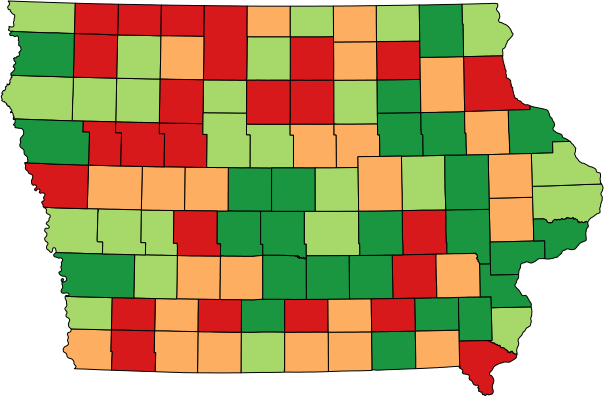
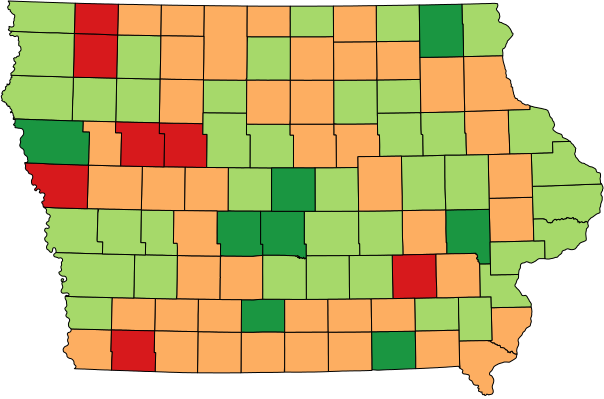
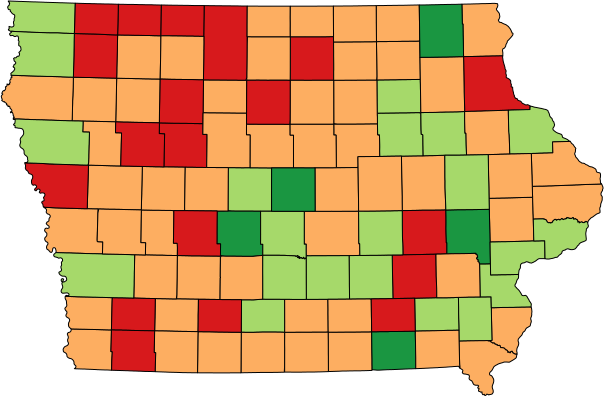
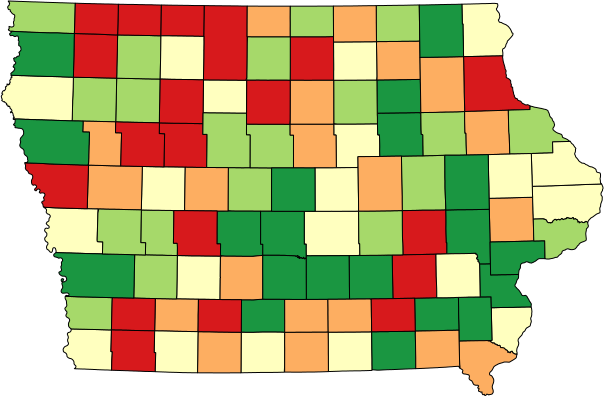
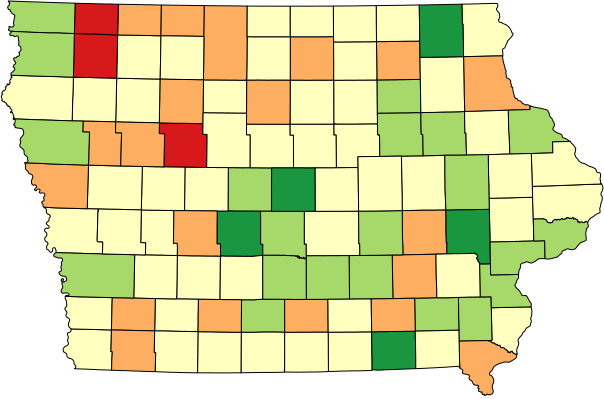
Purpose: To help Vitalnet users better understand the differences between different methods for setting map ranges, this page compares "Natural Breaks" (NB) and two alternative range algorithms: "Equal Counts" (quantiles) (EC) and "Equal Intervals" (EI).
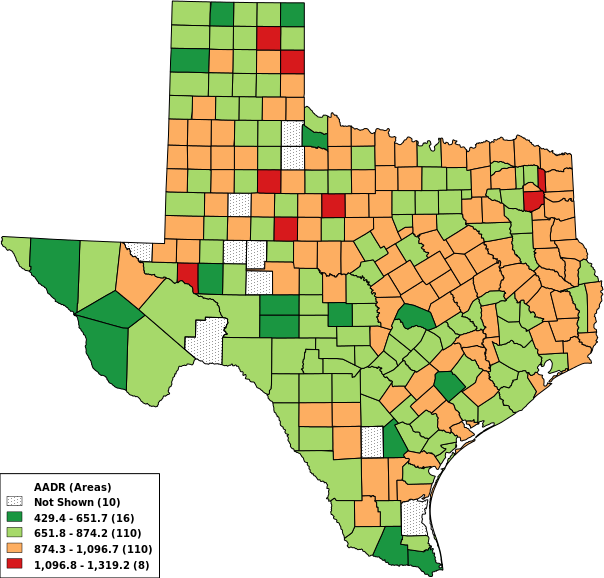
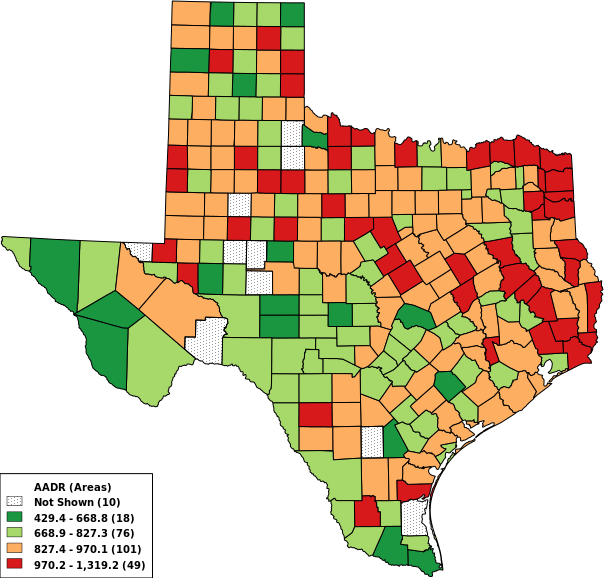
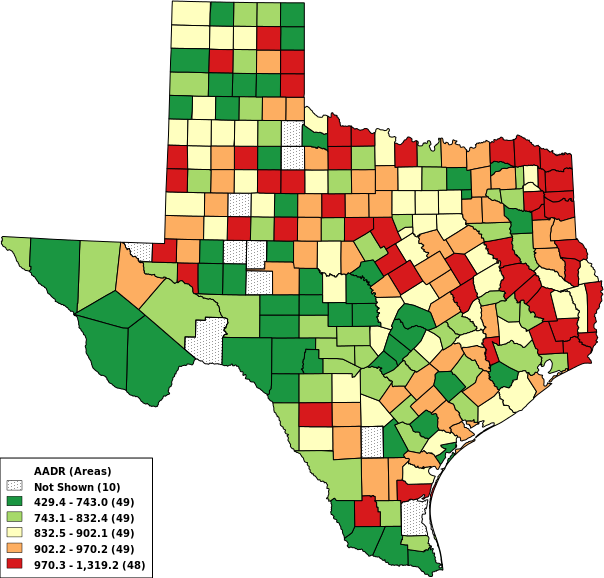
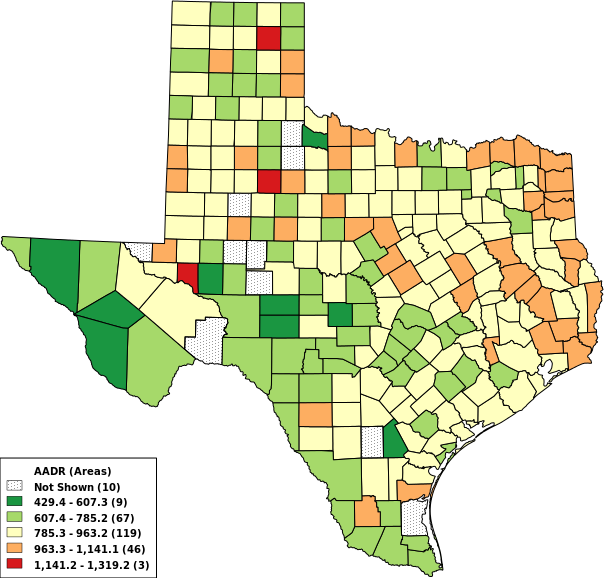
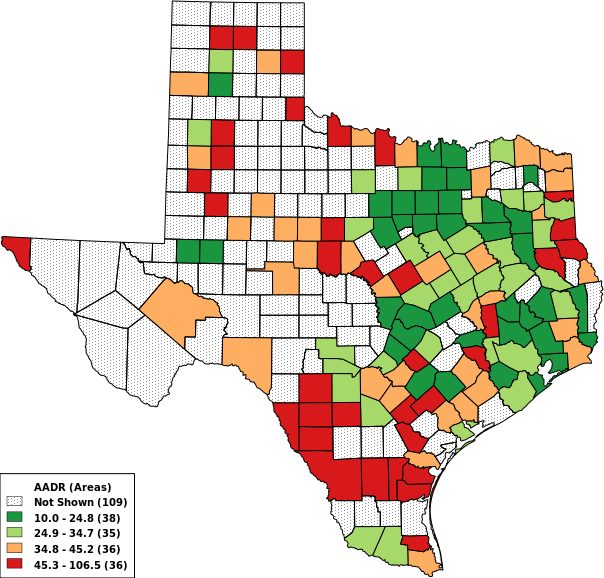
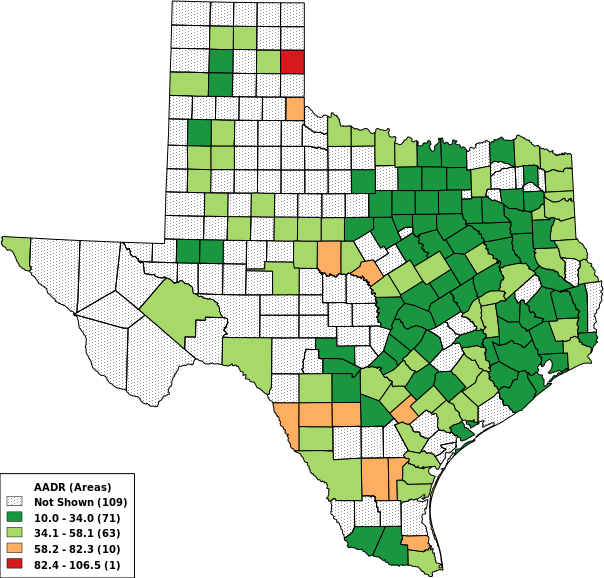
Method and Results: A series of commonly made maps was used for the comparisons, using three to five ranges. While somewhat arbitrary, these are typical maps that would be made, and serve as a useful way to compare the three methods. The maps use the "Diverging Green-Yellow-Red" color palette. The "Sequential Grey" palette produced similar findings. GVF (goodness of variance fit), the distribution of the underlying data, and visual inspection were used to assess the maps. A higher GVF is better, indicates that the method did a good job of classifying the counties into ranges. The statistics (GVF and other) for each map may be viewed by viewing the HTML source. Of course, there is nothing "magical" about GVF scores. Possibly other variance measures could be used. But GVF is a reasonable variance indicator.
Map Comparisons: Each example below has our comments (in parentheses). At the very end are some conclusions, our thoughts about natural breaks.
TX 2005 Deaths, 4 Ranges
| Method | GVF (higher is better) |
|---|---|
| Equal Counts |
|
| Equal Intervals |
|
| Natural Breaks |
|
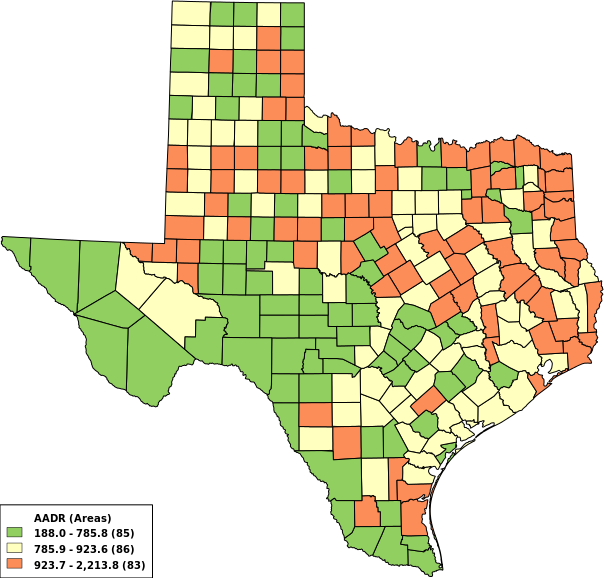
TX 2005 Age Adjusted Death Rate, 3 Ranges
| Method | GVF (higher is better) |
|---|---|
| Equal Counts |
|
| Equal Intervals |
|
| Natural Breaks |
|
TX 2005 Age Adjusted Death Rate, 4 Ranges
| Method | GVF (higher is better) |
|---|---|
| Equal Counts |
|
| Equal Intervals |
|
| Natural Breaks |
|
TX 2005 Age Adjusted Death Rate, 5 Ranges
| Method | GVF (higher is better) |
|---|---|
| Equal Counts |
|
| Equal Intervals |
|
| Natural Breaks |
|
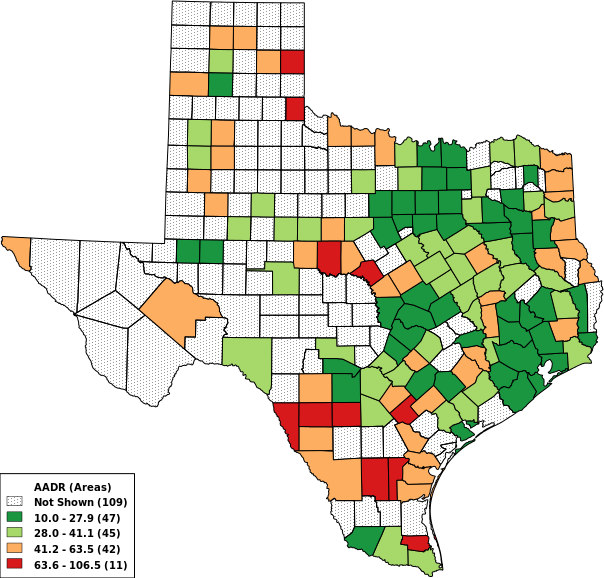
TX 2005 Age Adjusted Death Rate, 3 Ranges, Suppress if ≤ 10 Deaths
| Method | GVF (higher is better) |
|---|---|
| Equal Counts |
|
| Equal Intervals |
|
| Natural Breaks |
|
TX 2005 Age Adjusted Death Rate, 4 Ranges, Suppress if ≤ 10 Deaths
| Method | GVF (higher is better) |
|---|---|
| Equal Counts |
|
| Equal Intervals |
|
| Natural Breaks |
|
TX 2005 Age Adjusted Death Rate, 5 Ranges, Suppress if ≤ 10 Deaths
| Method | GVF (higher is better) |
|---|---|
| Equal Counts |
|
| Equal Intervals |
|
| Natural Breaks |
|
TX 2005 Age Adjusted Death Rate, Cancer, 4 Ranges
| Method | GVF (higher is better) |
|---|---|
| Equal Counts |
|
| Equal Intervals |
|
| Natural Breaks |
|
TX 2005 Age Adjusted Death Rate, Cancer, 4 Ranges, Suppress if ≤ 5 Deaths
| Method | GVF (higher is better) |
|---|---|
| Equal Counts |
|
| Equal Intervals |
|
| Natural Breaks |
|
TX 2005 Age Adjusted Death Rate, Diabetes, 4 Ranges
| Method | GVF (higher is better) |
|---|---|
| Equal Counts |
|
| Equal Intervals |
|
| Natural Breaks |
|
TX 2005 Age Adjusted Death Rate, Diabetes, 4 Ranges, Suppress if ≤ 5 Deaths
| Method | GVF (higher is better) |
|---|---|
| Equal Counts |
|
| Equal Intervals |
|
| Natural Breaks |
|
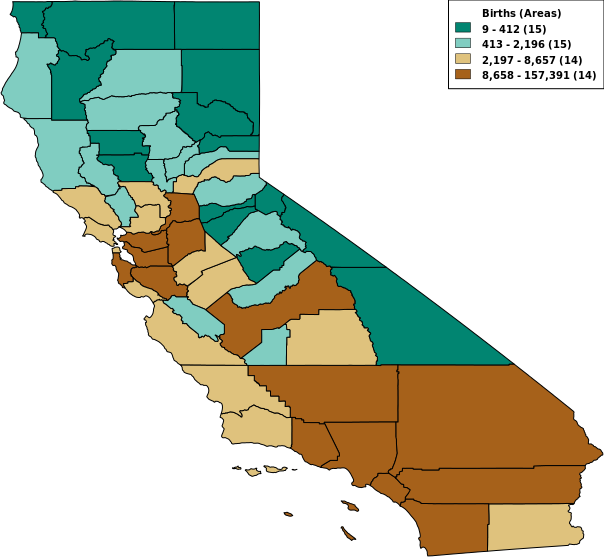
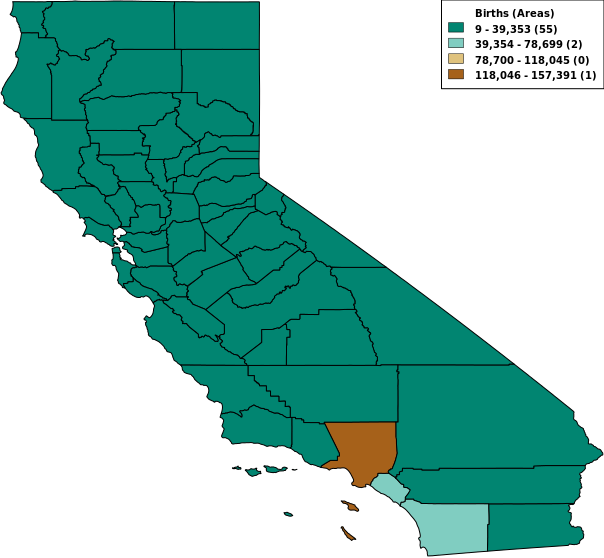
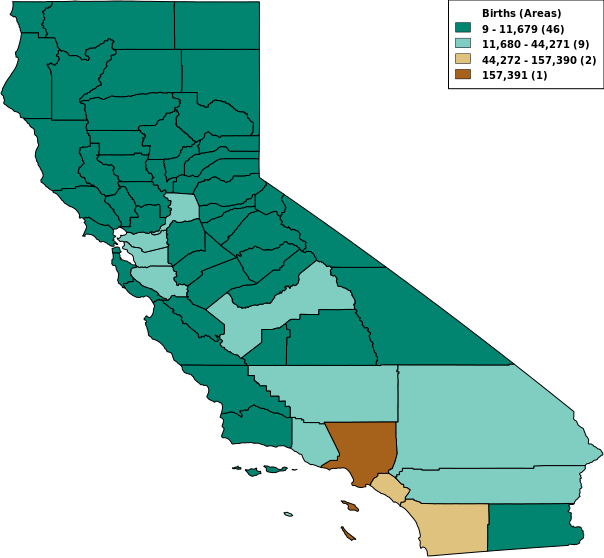
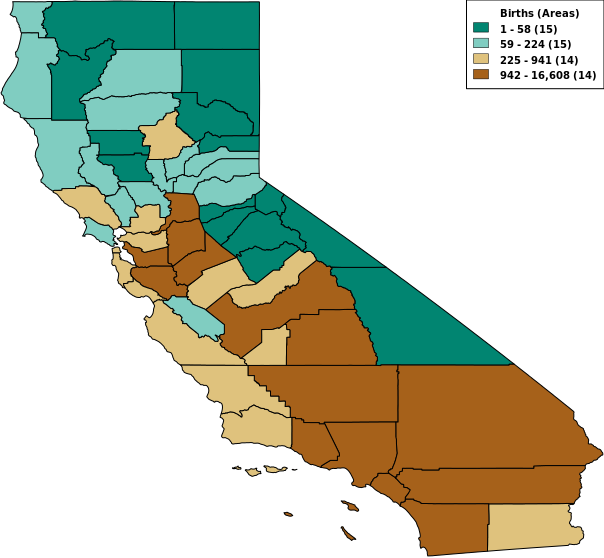
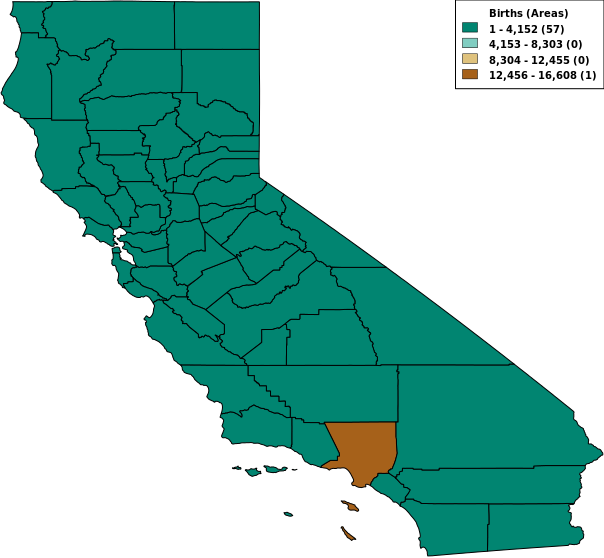
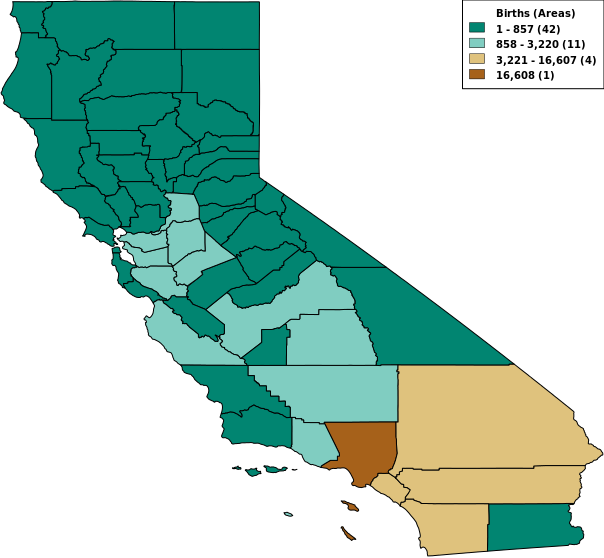
CA 2000 Births, 4 Ranges
| Method | GVF (higher is better) |
|---|---|
| Equal Counts |
|
| Equal Intervals |
|
| Natural Breaks |
|
CA 2000 Births, Age 15-19, 4 Ranges
| Method | GVF (higher is better) |
|---|---|
| Equal Counts |
|
| Equal Intervals |
|
| Natural Breaks |
|
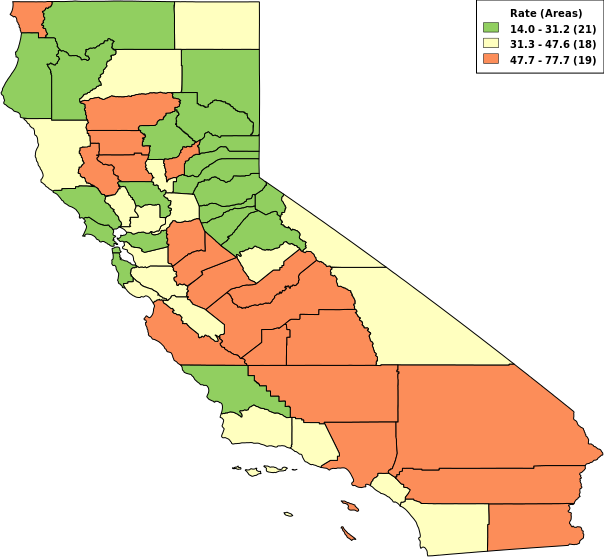
CA 2000 Births per 1,000 Females, Age 15-19, 3 Ranges
| Method | GVF (higher is better) |
|---|---|
| Equal Counts |
|
| Equal Intervals |
|
| Natural Breaks |
|
CA 2000 Births per 1,000 Females, Age 15-19, 4 Ranges
| Method | GVF (higher is better) |
|---|---|
| Equal Counts |
|
| Equal Intervals |
|
| Natural Breaks |
|
CA 2000 Births per 1,000 Females, Age 15-19, 5 Ranges
| Method | GVF (higher is better) |
|---|---|
| Equal Counts |
|
| Equal Intervals |
|
| Natural Breaks |
|
CA 2000 Cesarean Rate, 3 Ranges
| Method | GVF (higher is better) |
|---|---|
| Equal Counts |
|
| Equal Intervals |
|
| Natural Breaks |
|
CA 2000 Cesarean Rate, 4 Ranges
| Method | GVF (higher is better) |
|---|---|
| Equal Counts |
|
| Equal Intervals |
|
| Natural Breaks |
|
CA 2000 Cesarean Rate, 5 Ranges
| Method | GVF (higher is better) |
|---|---|
| Equal Counts |
|
| Equal Intervals |
|
| Natural Breaks |
|
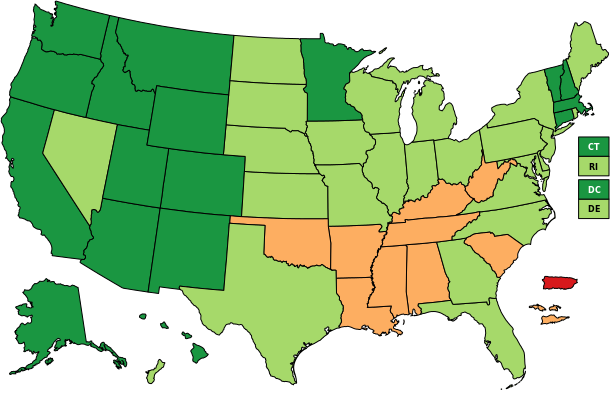
US 2005 % Obese, 18+, 4 Ranges
| Method | GVF (higher is better) |
|---|---|
| Equal Counts |
|
| Equal Intervals |
|
| Natural Breaks |
|
US 2005 % Current Smoker, 18+, 4 Ranges
| Method | GVF (higher is better) |
|---|---|
| Equal Counts |
|
| Equal Intervals |
|
| Natural Breaks |
|
US 2005 % Satisfied with Life, 18+, 4 Ranges
| Method | GVF (higher is better) |
|---|---|
| Equal Counts |
|
| Equal Intervals |
|
| Natural Breaks |
|
US 2005 % Leisure Time Exercise, 18+, 4 Ranges
| Method | GVF (higher is better) |
|---|---|
| Equal Counts |
|
| Equal Intervals |
|
| Natural Breaks |
|
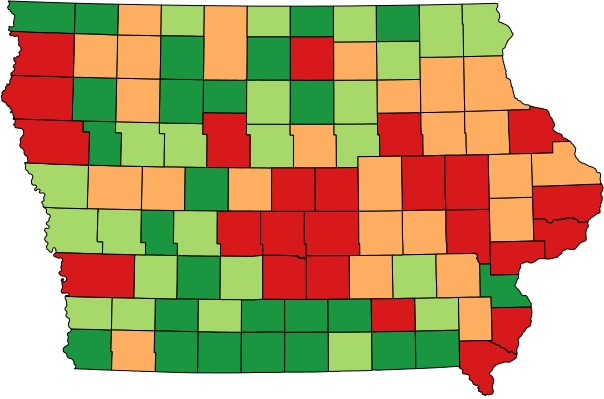
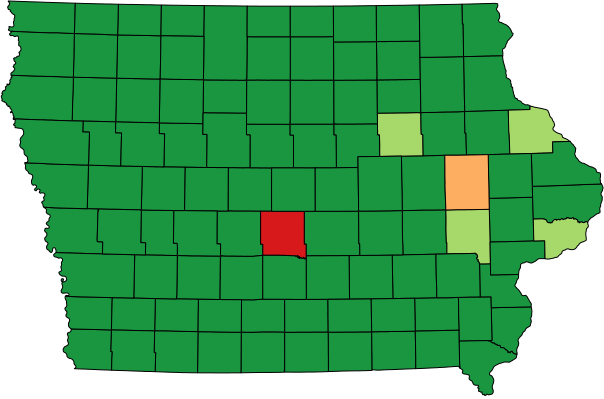
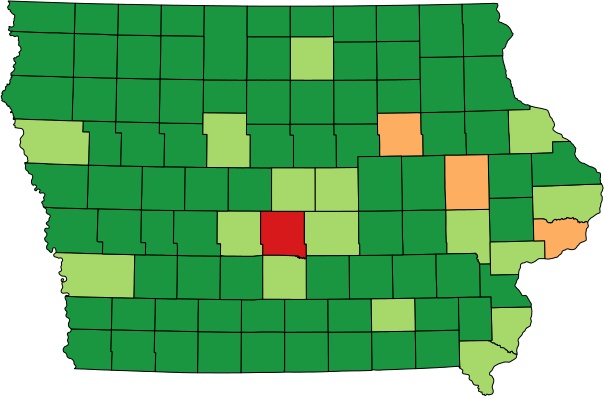
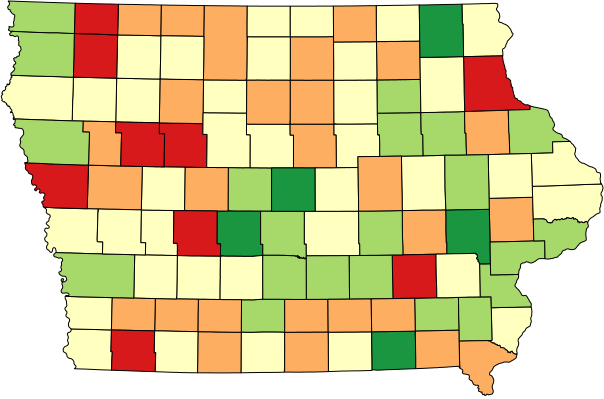
Iowa 2005 Cancer Cases, 4 Ranges
| Method | GVF (higher is better) |
|---|---|
| Equal Counts |
|
| Equal Intervals |
|
| Natural Breaks |
|
Iowa 2005 Cancer Incidence Rate, 3 Ranges
| Method | GVF (higher is better) |
|---|---|
| Equal Counts |
|
| Equal Intervals |
|
| Natural Breaks |
|
Iowa 2005 Cancer Incidence Rate, 4 Ranges
| Method | GVF (higher is better) |
|---|---|
| Equal Counts |
|
| Equal Intervals |
|
| Natural Breaks |
|
Iowa 2005 Cancer Incidence Rate, 5 Ranges
| Method | GVF (higher is better) |
|---|---|
| Equal Counts |
|
| Equal Intervals |
|
| Natural Breaks |
|
Conclusions: Our overall conclusions, based on the maps:
(1) Use "Natural Breaks" with count data maps. Count data (eg, births, deaths) are typically greatly skewed (a few areas with very high counts). So "Equal Count" maps poorly display count data, and have extremely low GVF scores. For the same reason, "Equal Interval" maps with count data also have relatively low GVF scores. So "Natural Breaks" is almost always the best choice for mapping count data.
(2) Map appearance can differ greatly, EC vs IE vs NB. Most maps have a non-uniform data distribution. In those cases, the appearance will be quite different using the three different methods.
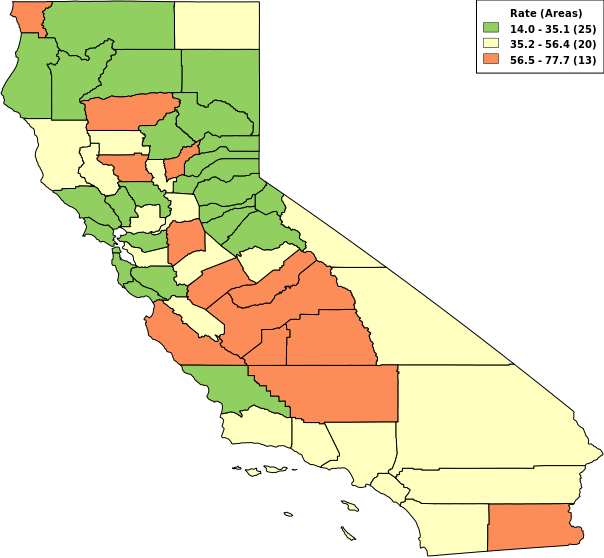
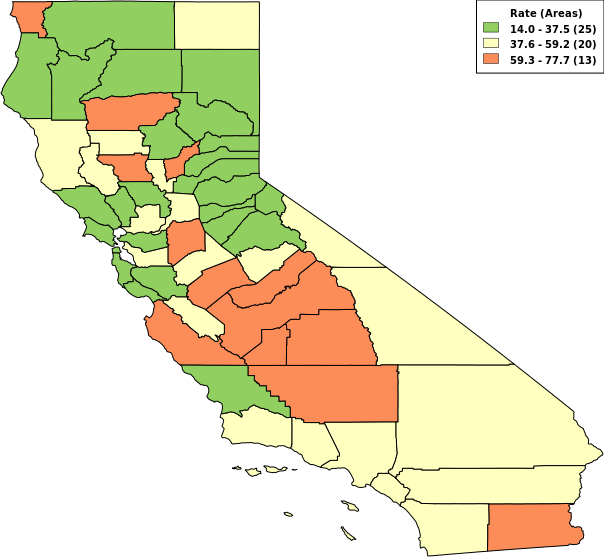
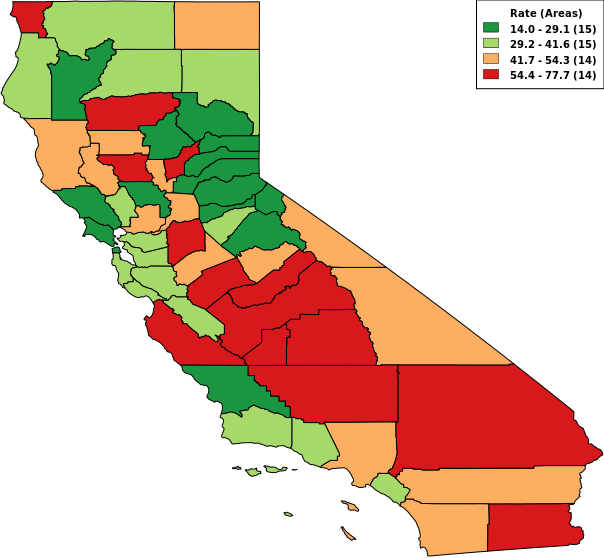
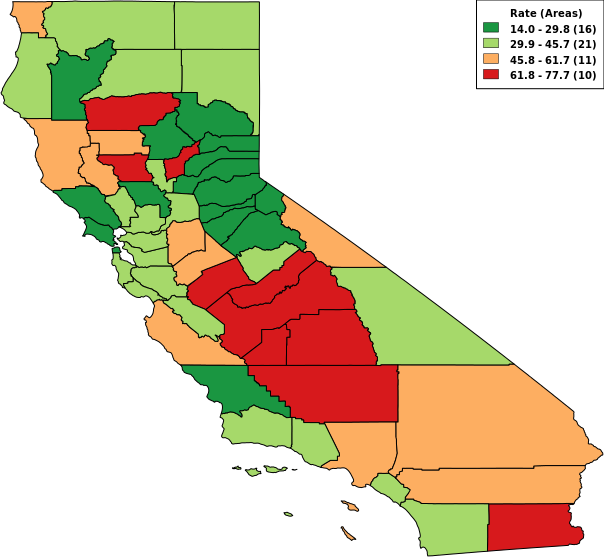
(3) Sometimes the appearance is the same, EC vs IE vs NB. If the data are pretty much linearly distributed, from low to high, the three methods will produce about the same results. "CA 2000 Births per 1,000 Females, Age 15-19" (Map Series #14) is a good example.
(4) Cell suppression helps greatly if low # of events. A rate based upon a small number of events is unstable, and will result in some extremely high rates (with high confidence interval). If suppressing a few areas eliminates extreme values, it usually increases the GVF score, and produces a map that is easier to interpret by removing "noise".
(5) Overall, "Natural Breaks" is better for rate maps. Both "Equal Counts" and "Equal Intervals" can easily do poorly when there is a non-linear distribution of values, with resulting low GVF scores and potentially misleading maps. A good example is "TX 2005 Age Adjusted Death Rate, Cancer" (Map Series #8).
(6) "Equal Counts" can be cosmetically appealing. "Equal Counts" uses each color equally. So it usually produces a more "colorful" map, perhaps for use in an atlas with more visual than epidemiological purpose. But more "colorful" does not translate to more "meaningful".
(7) Look at the underlying data. It is a good idea to make all three map types, and look at the actual data distribution, before publishing a map. Normally, it is best to let the numbers "speak for themselves". That is a good argument to normally use "Natural Breaks", which always produces the best GVF score.
Let us know if (1) you have thoughts or suggestions about natural breaks, the map examples, or other methods, or (2) you are interested in working together on further research on this topic, for publication in the peer-review literature.
